

2026 Outlook: Climbing The Wall of Worry
This year’s annual outlook is not about narratives, predictions, or consensus views.
It’s about signal — stripped down, time-tested, and rooted in how markets actually turn.
As we move into 2026, the noise is overwhelming.
Is AI peaking after a historic run?
Can equities continue defying gravity?
Is crypto “over” after a difficult 2025 or setting up for something far bigger?
And most importantly: where are the real signals hiding?
These are the questions dominating sentiment right now. And sentiment, as usual, is pulling investors in the wrong direction.
This report exists to do the opposite.
Inside this outlook, I’m not guessing. I’m mapping time, price, structure, and probability — using the same cycle frameworks and techniques that have consistently kept us ahead of major turning points in recent years. Not by reacting late, but by preparing early.
2026 will not be a straight line.
It will not reward patience alone.
And it will absolutely punish those trading headlines instead of timing.
What you’re holding here is a roadmap — not just for Bitcoin, but for crypto, equities, and the macro forces tying them together. You’ll see where cycles converge, where psychology breaks, and where opportunity quietly builds while most are distracted by fear or euphoria.
In this outlook, we’ll walk through:
The dominant Gann cycles and time windows that matter most in 2026
Additional multi-year cycles aligning beneath the surface
The macro and political forces likely to catalyze — not derail — volatility
A clear, time-based framework for when markets are most vulnerable… and most explosive
By the end, you won’t just have an opinion on 2026.
You’ll have dates, ranges, and a complete plan.
You’ll know where the market is most likely to accelerate, where it’s most likely to break, and why the middle of this year may prove far more important than most currently understand.
Winners don’t move on certainty.
They move on preparation.
And 2026 is shaping up to be a year where those who understand time will dramatically outperform those who don’t.
Let’s get into the work.
The public version of this article only scratches the surface.
Paid members receive the full macro reports including the cycle work, structural relationships between major asset classes, and the timing windows we track throughout the year.
This research focuses on identifying major turning points in markets before the narrative catches up. From equities to the dollar to crypto, the goal is always the same: understand the underlying structure and position ahead of the move.
If you want access to the full analysis, macro forecasts, and the signals we are watching as this cycle unfolds, become a paid subscriber.
Serious market participants can also join the Founding Member tier which includes private discussion, deeper daily insight into the markets, and the high-conviction opportunities developing across crypto.
Upgrade below to read the full report.
Major Cycles
Beginning with the major cycles I’m sure many of you have seen this chart by the late 1800s pig farmer Samuel Benner.
It’s been highly popularized in recent years and has become somewhat of a meme but none the less it has been quite accurate and something worth noting.
Benner lists 2026 as a B year or “ Years of Good Times, High Prices and the time to sell Stocks and values of all kinds”

Looking back over the prior “B” years, he hasn’t had a bad run, considering he made this forecast over 100 years ago. 1989, 1999, and 2007 all proved to be quite timely predictions.
However, the last B year was 2016 which did not fare so well if you decided to sell stocks based on this chart. They went on to much bigger and stronger things in 2017. So it’s something to be aware of but not something to act on.
Next we have the Gann financial time table which has been remastered. This one I found at thetimefactor.com

This table has been a little closer in time and therefore a bit more accurate than Benner’s original prophecy.
What we do notice is that there is a common theme between Benner and Gann in suggesting that 2026 is going to be a good year of high prices.
We then have Gann’s decade cycle to visualize the average 10 year cycle and what we should roughly expect each year of a decade.

Of course its not always spot on but rather more of a guide as to what the typical decade cycle looks like.
In this case the sixth year of the decade tends to start strong and finish strong with no real crash or panic but rather some mid year volatility to navigate.
Overall, between two legendary forecasters we have alignment that 2026 should be a prosperous year for the US economy and a strong year for stock prices.
Presidential Cycles
The presidential cycle is another very popular cycle framework for most forecasters.
Below you can see a graphic of the average returns during a presidential term.
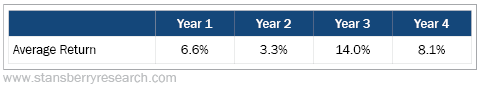
You’ll note that year two of a president’s term is typically the worst year of the cycle with the third year actually being the best.
That said, we know every cycle comes with context and underlying conditions.
So to get a more accurate depiction of what 2026 may bring I asked Grok what the S&P returns are during the second year of a presidents second term rather than the broad brushstroke of the 2nd year of the presidency and here was the answer.
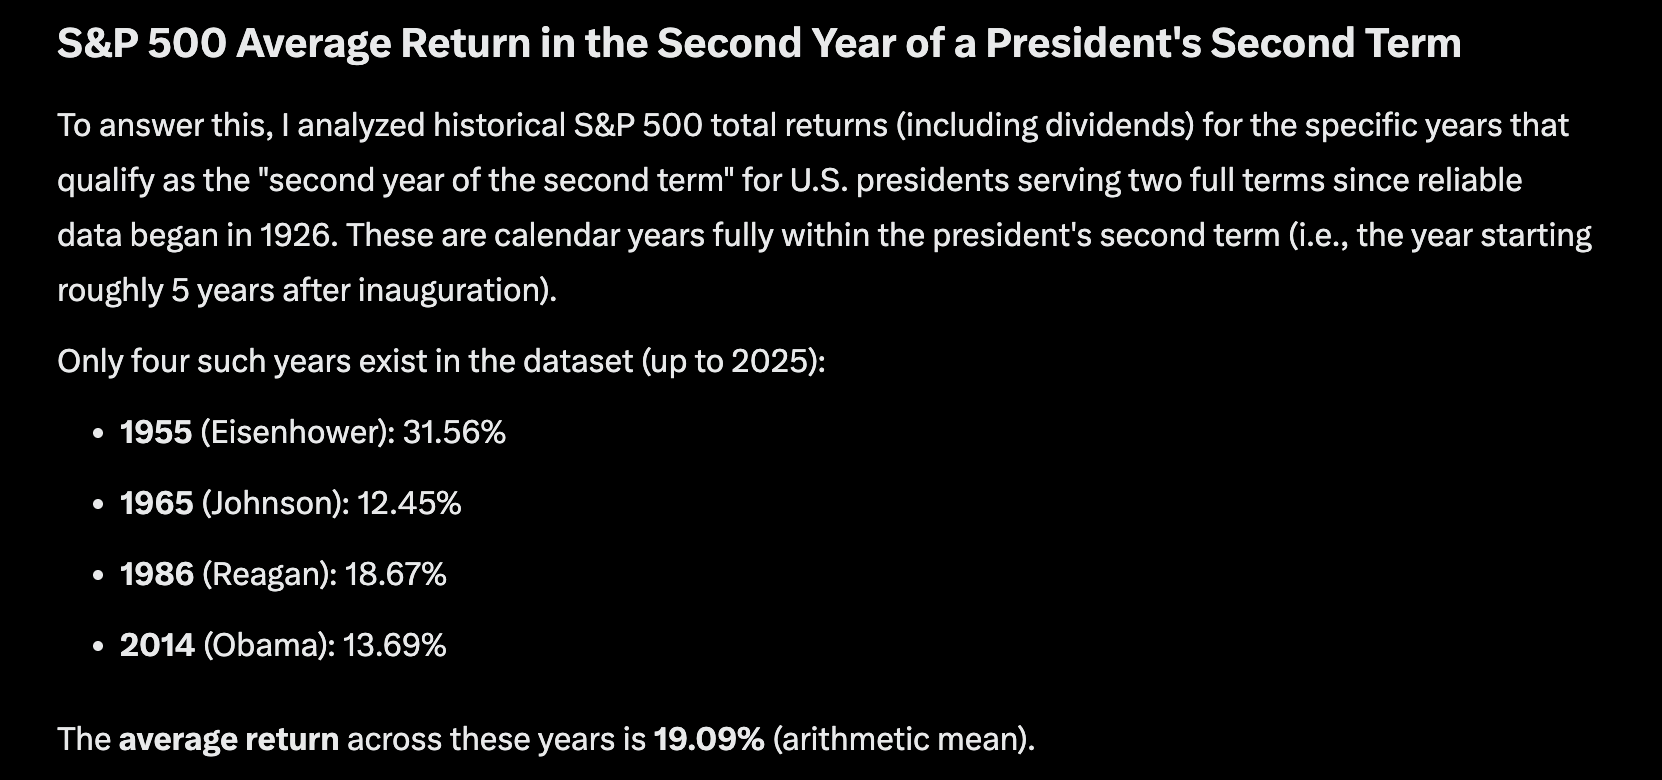
You can see that since 1926 the data suggests much better returns than just the average 3.3%.
Then I further broke this down to ask Grok what the returns are for a second year in a second term with midterms in that same year and the below image was the result.
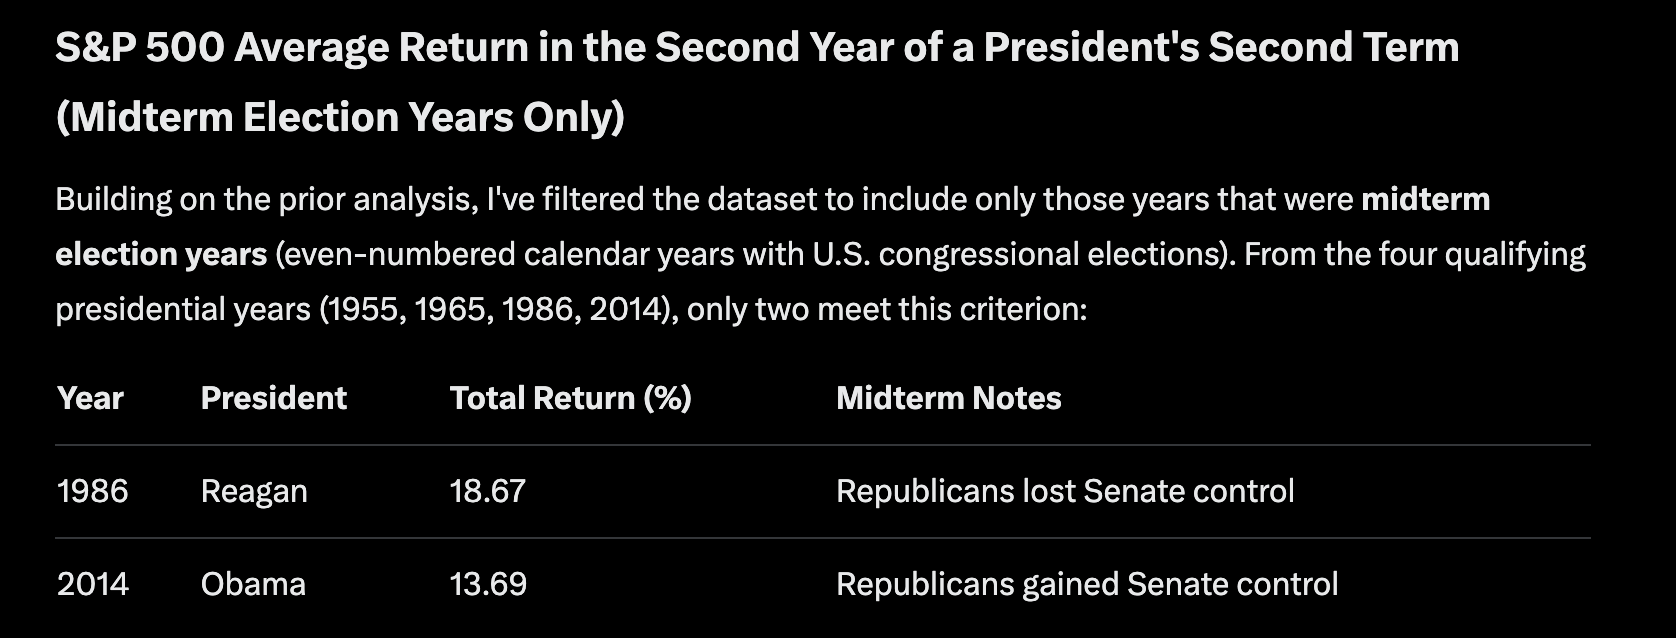
It’s only happened on two occasions since 1926, so it’s fairly rare, but the results were similar although slightly worse. In this scenario of the election cycle the S&P averaged +16.18% on the year.
Interestingly enough is the confluence this Trump term has shared with the 1980’s Reagan administration and the year 1986.
This was also the sixth year of the decade and in line with the 40 year cycle which we had tracked very closely this year.
Trump’s policies have been very similar to Reagan’s policies with America first mindset, deregulation, and tax cuts.
Overall, this presidential cycle could potentially keep us in line with the strong 40-45 year cycle we saw in the 1980’s and that suggests a +15% year for the stock market at minimum.
Stock Market Cycles
I went a little more in depth on the stock market cycles last year and it was by far our best forecast. We called for a -20% correction in the early part of the year followed by a major rally into year end and that is exactly what we got.
This year I am less concerned about our focus on stocks but with much more long term data than crypto it is very important to know what to generally expect from the equities market so we can get an idea of what crypto might do.
I have already suggested that it will be a strong up year again based on the forecasting cycles and the presidential cycles.
But lets break down the data a bit further to give us some timing and what to expect.
Starting with years ending in 6 back to 1870 on the SPX.
The average return is 8.44% with 10/15 years being bullish including 5/5 in the last 50 years and 8/10 in the last 100 years. Each year ending in 6 in the last 50 years has been up double digits with only one year coming in below 20%
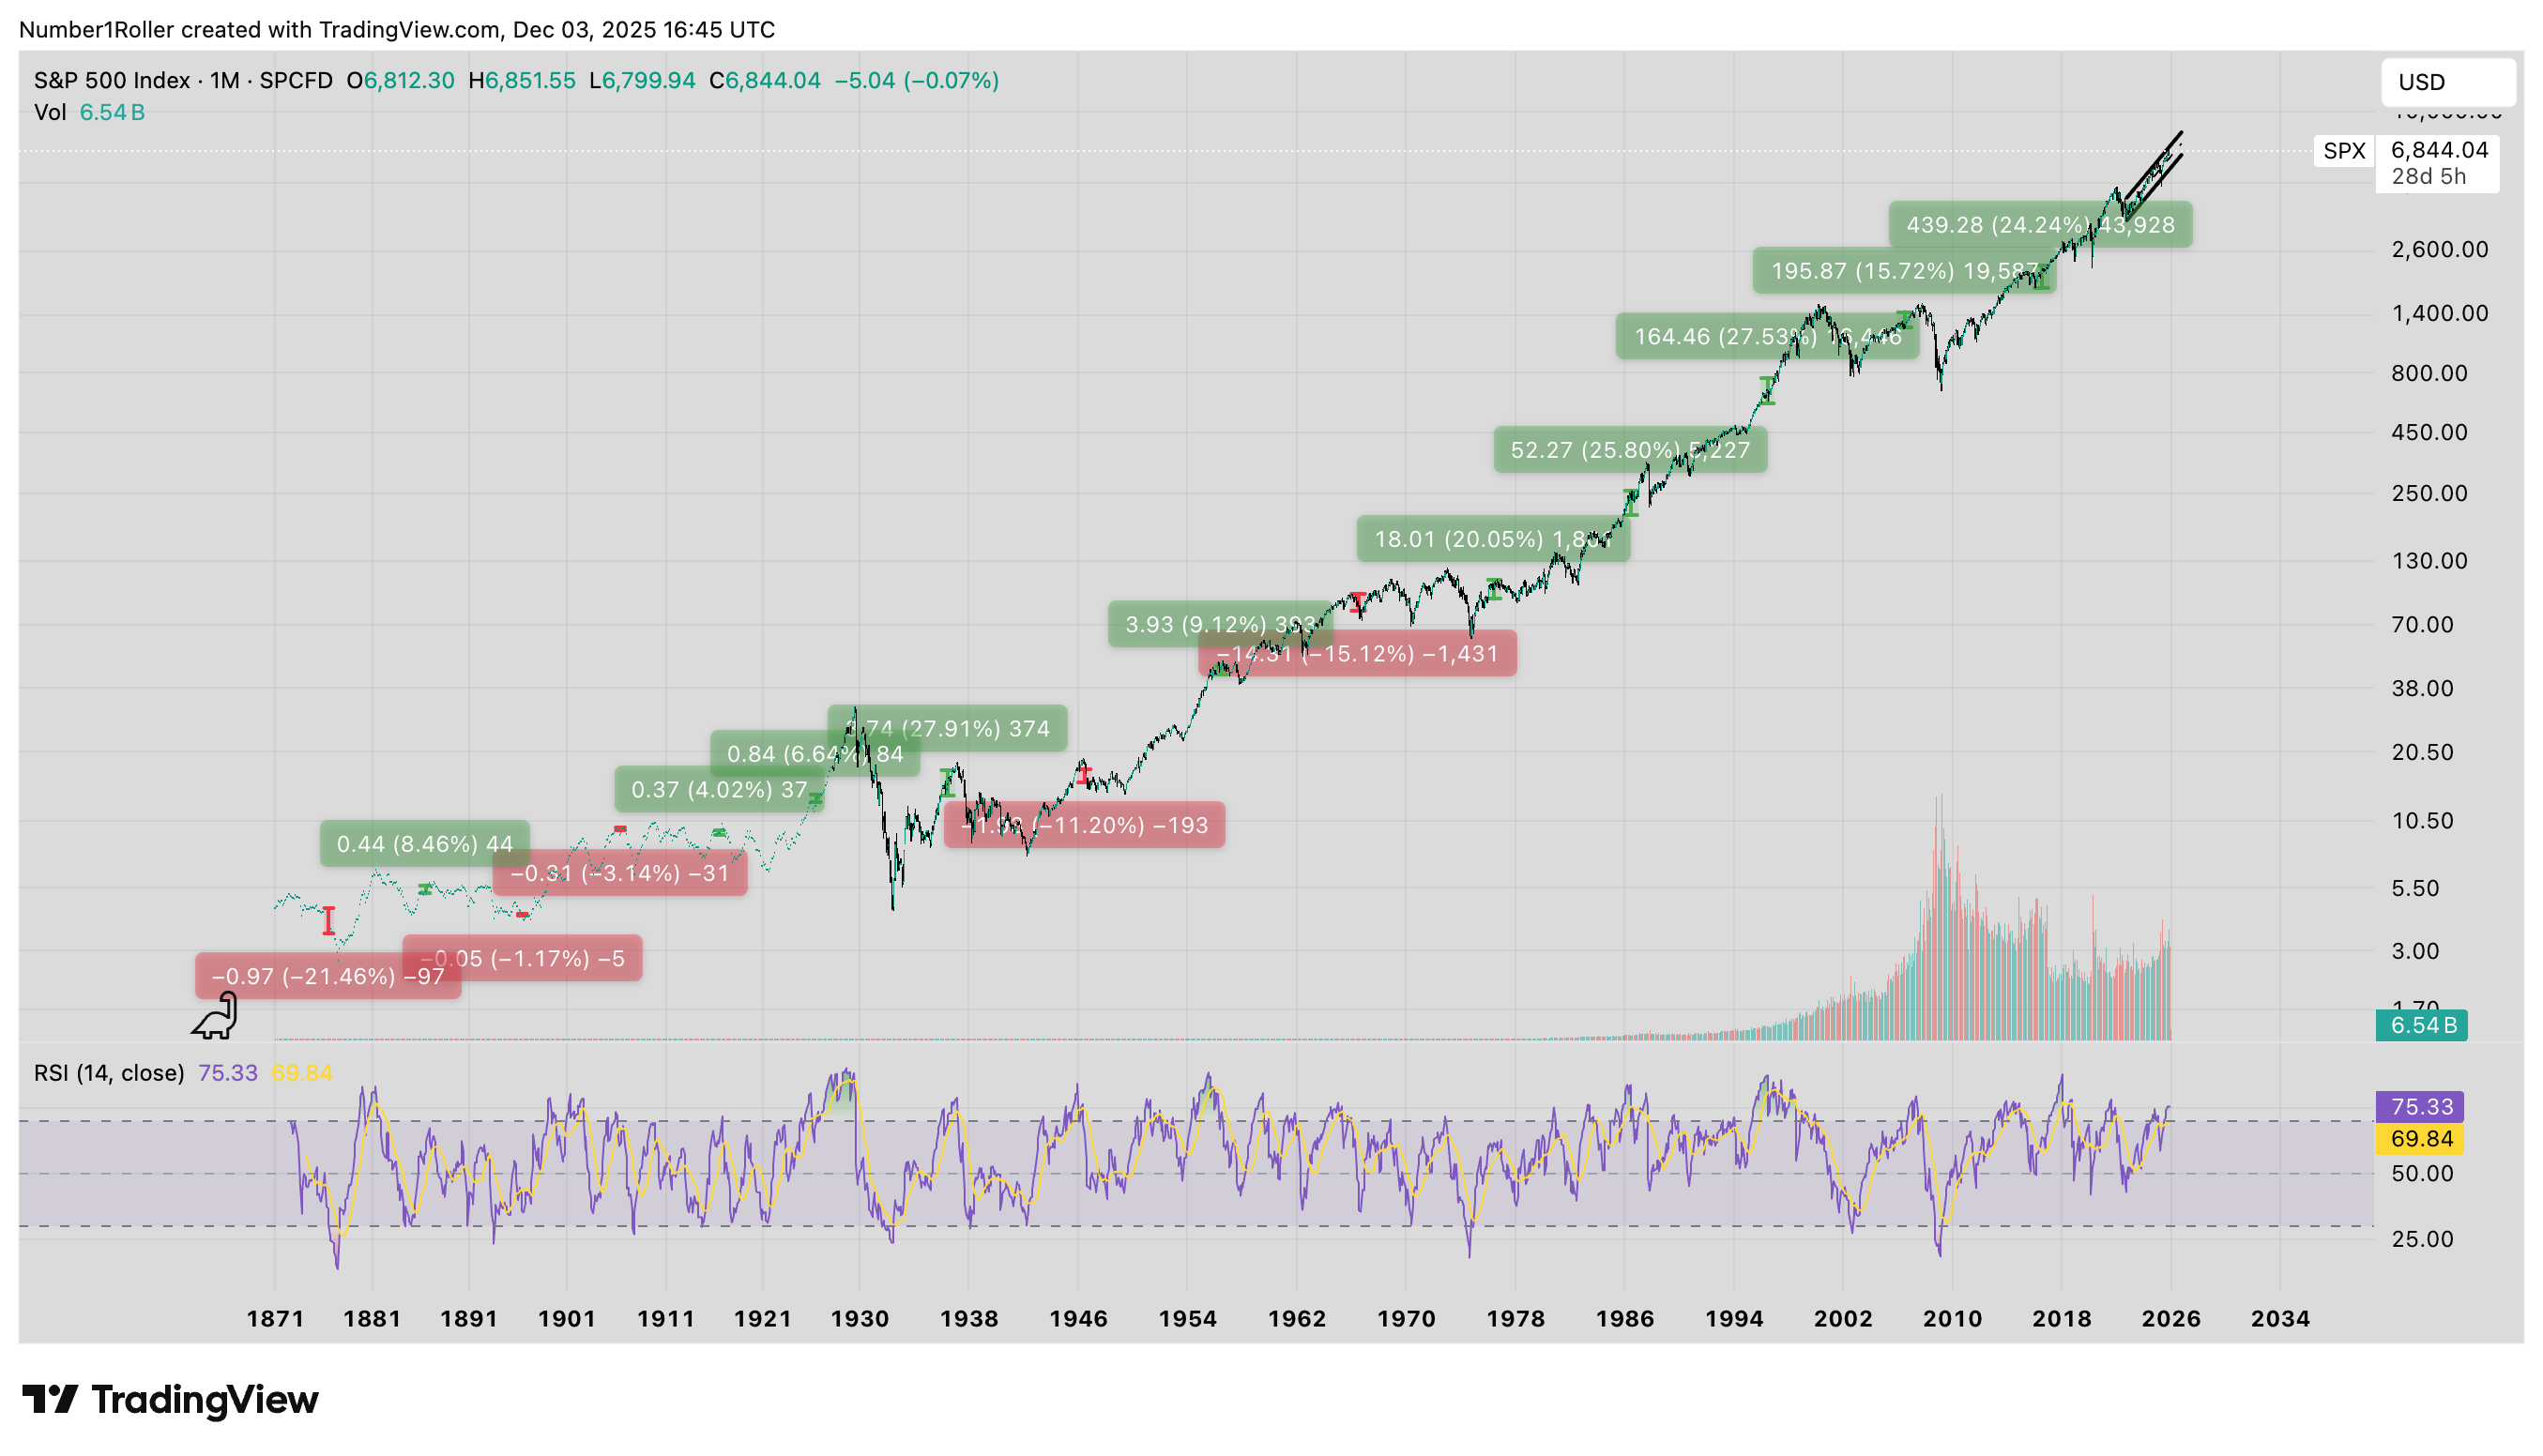
Now we can break that down into 10 year cycles and look how the year performed.
Gann described the 10 year cycle as a complete cycle and said the way to make up an annual forecast is look 10 years back as the current year will run very close to the 10 year cycle with minor variations.
Looking below at each 10 year cycle going back to 50 years (which is the “great” cycle) you will see just how right Gann was.
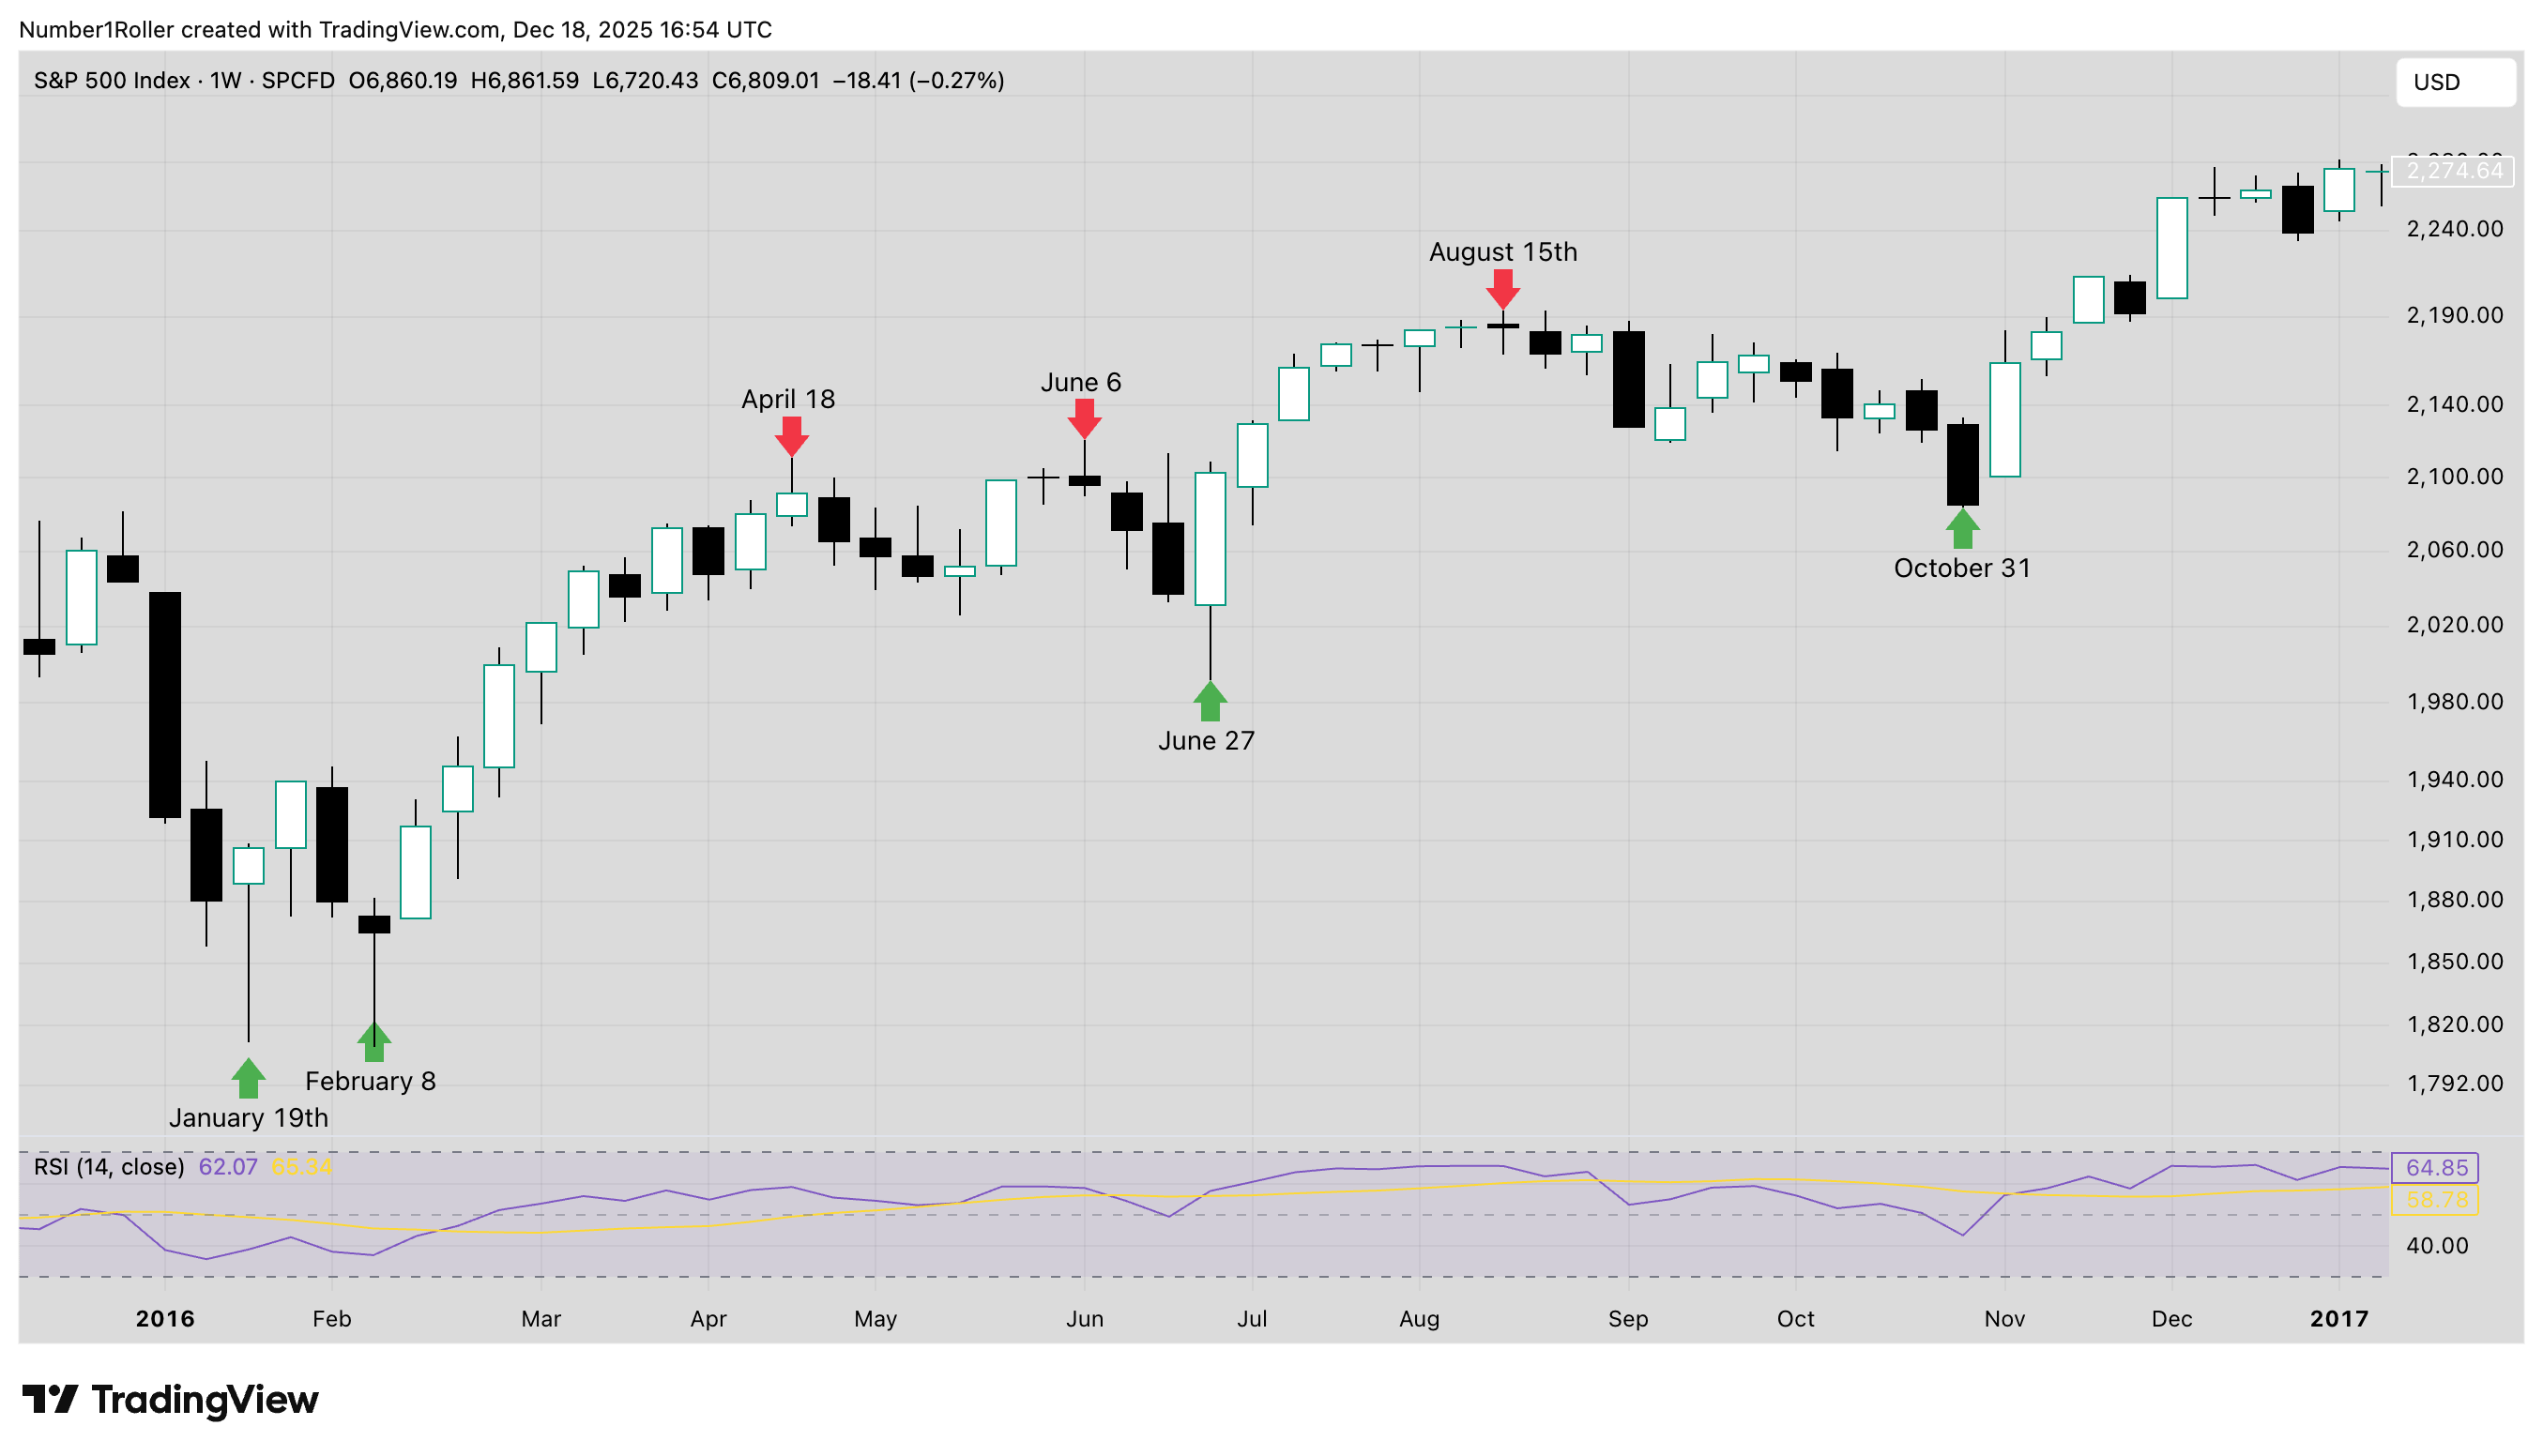
10 Year Cycle 2016 (+10.47%)
20 Year Cycle 2006 (+13.26%)
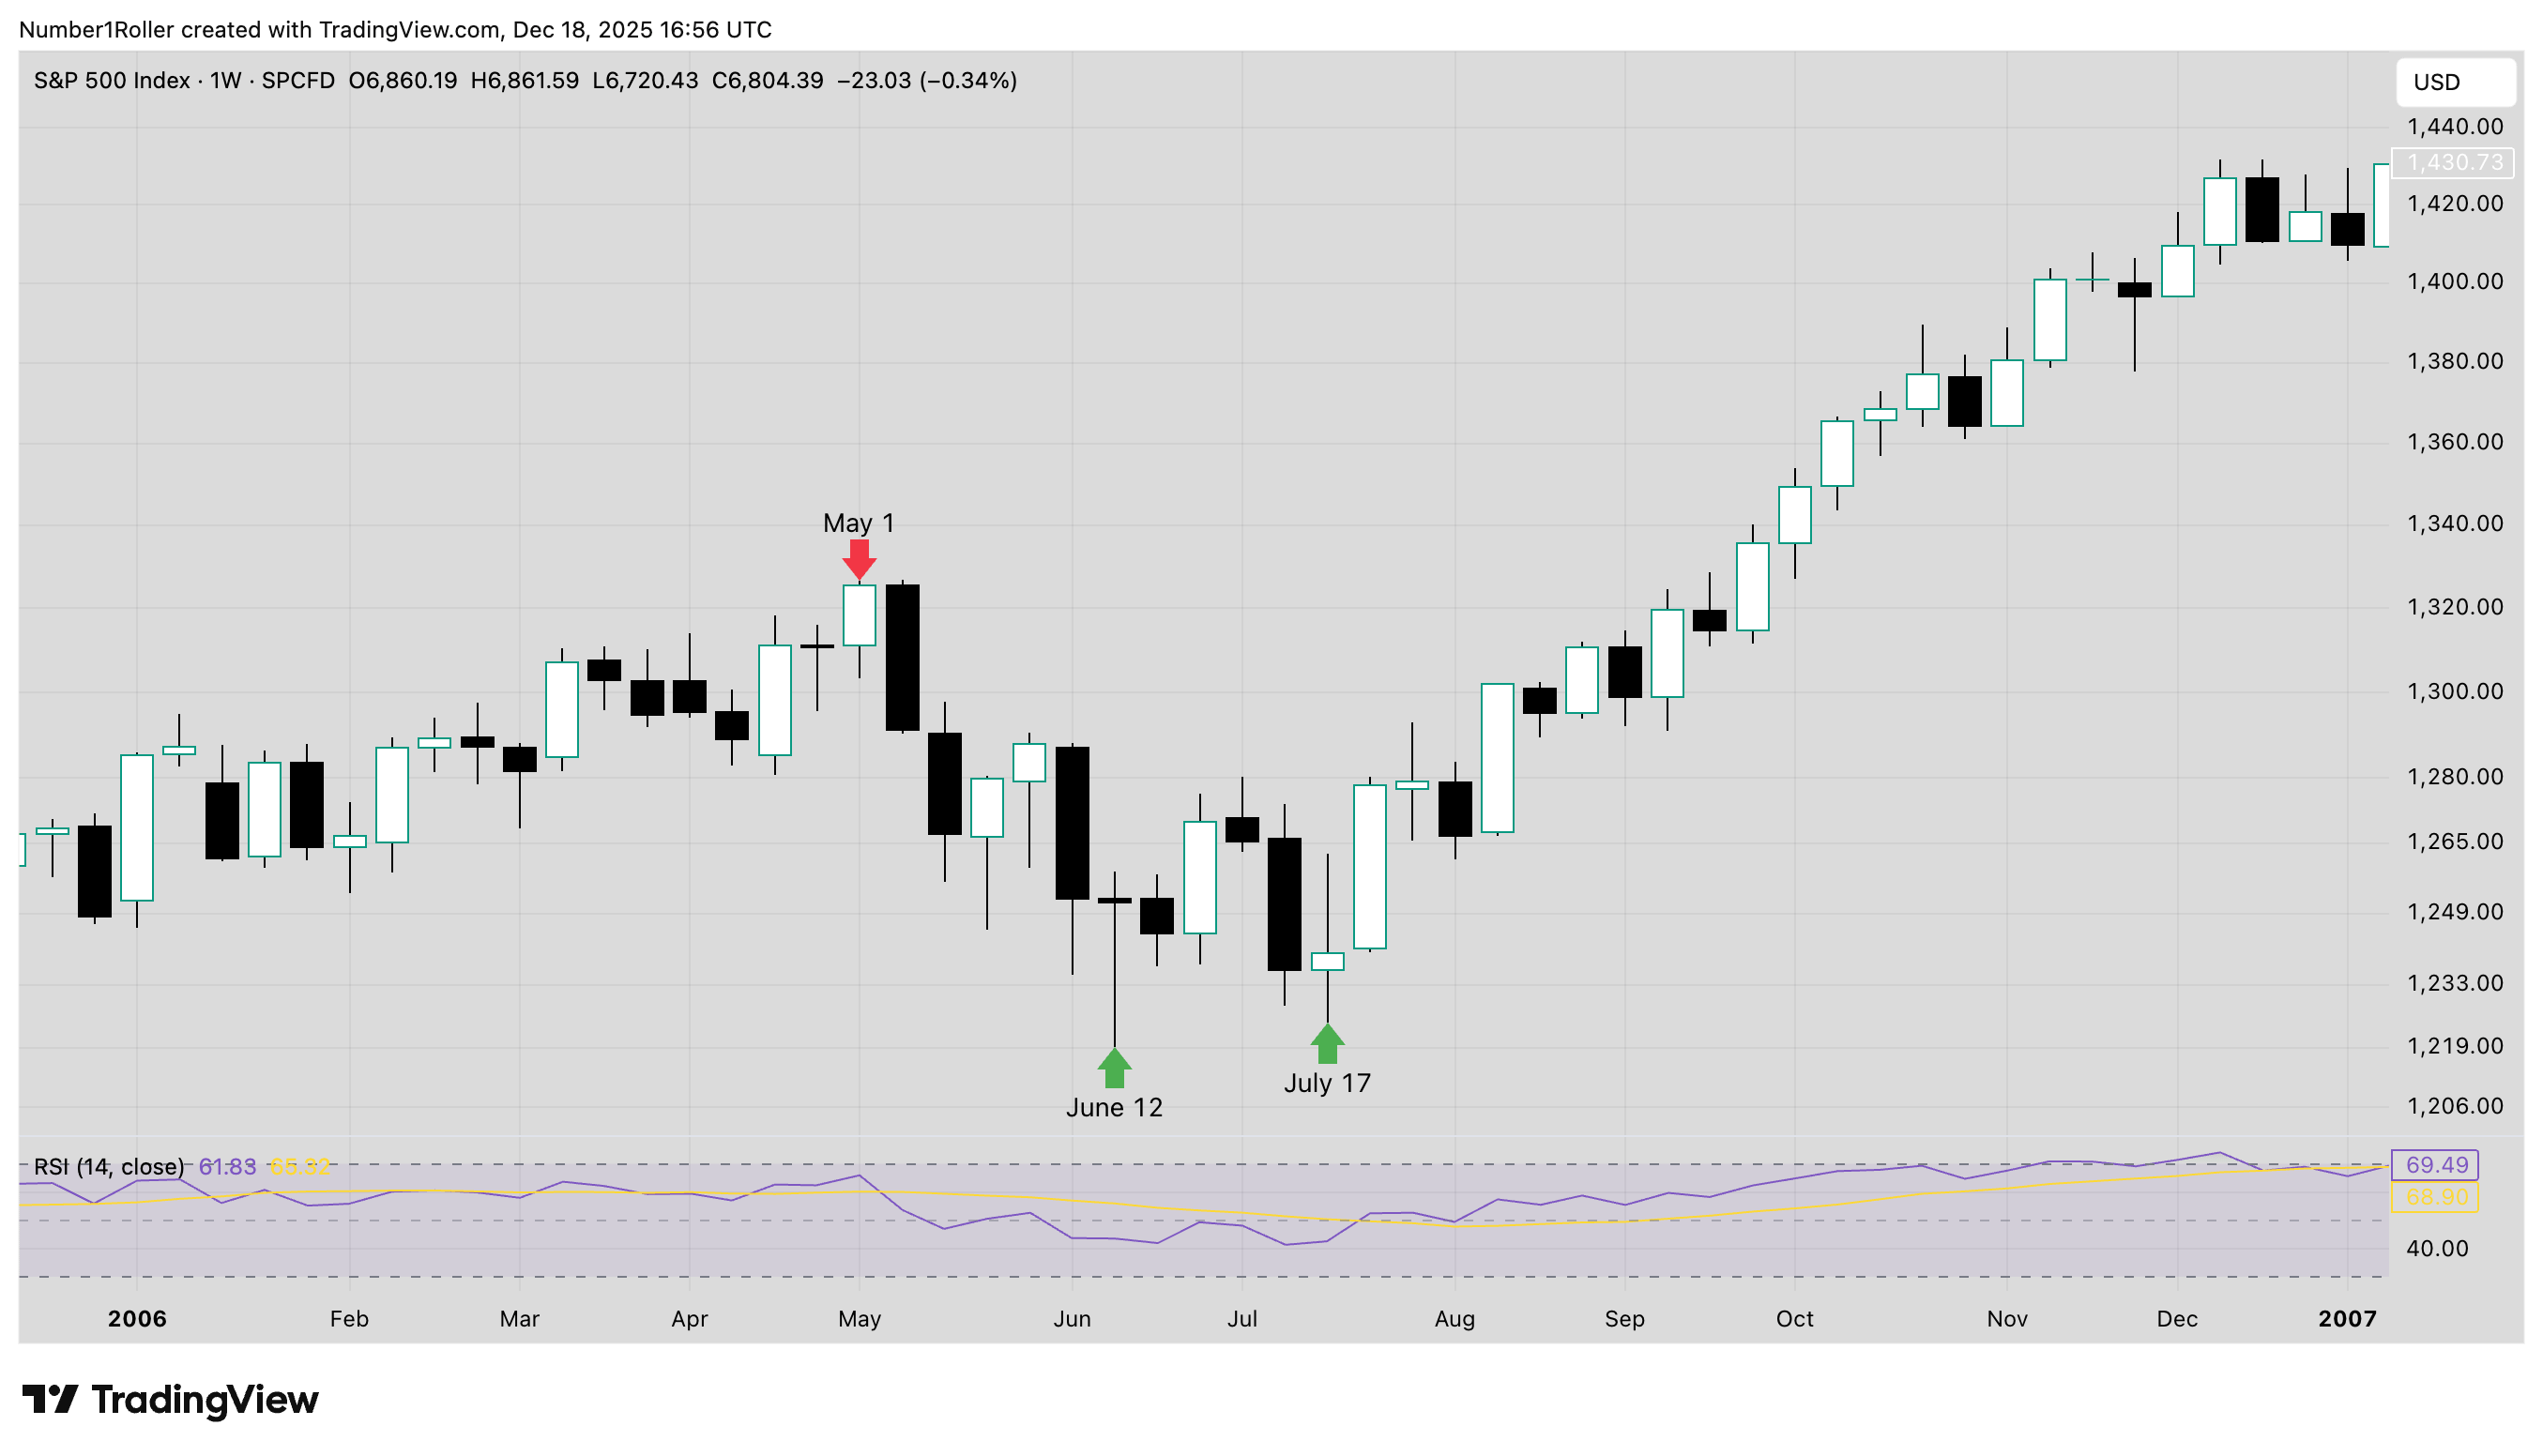
30 Year Cycle 1996 (+21.31%)
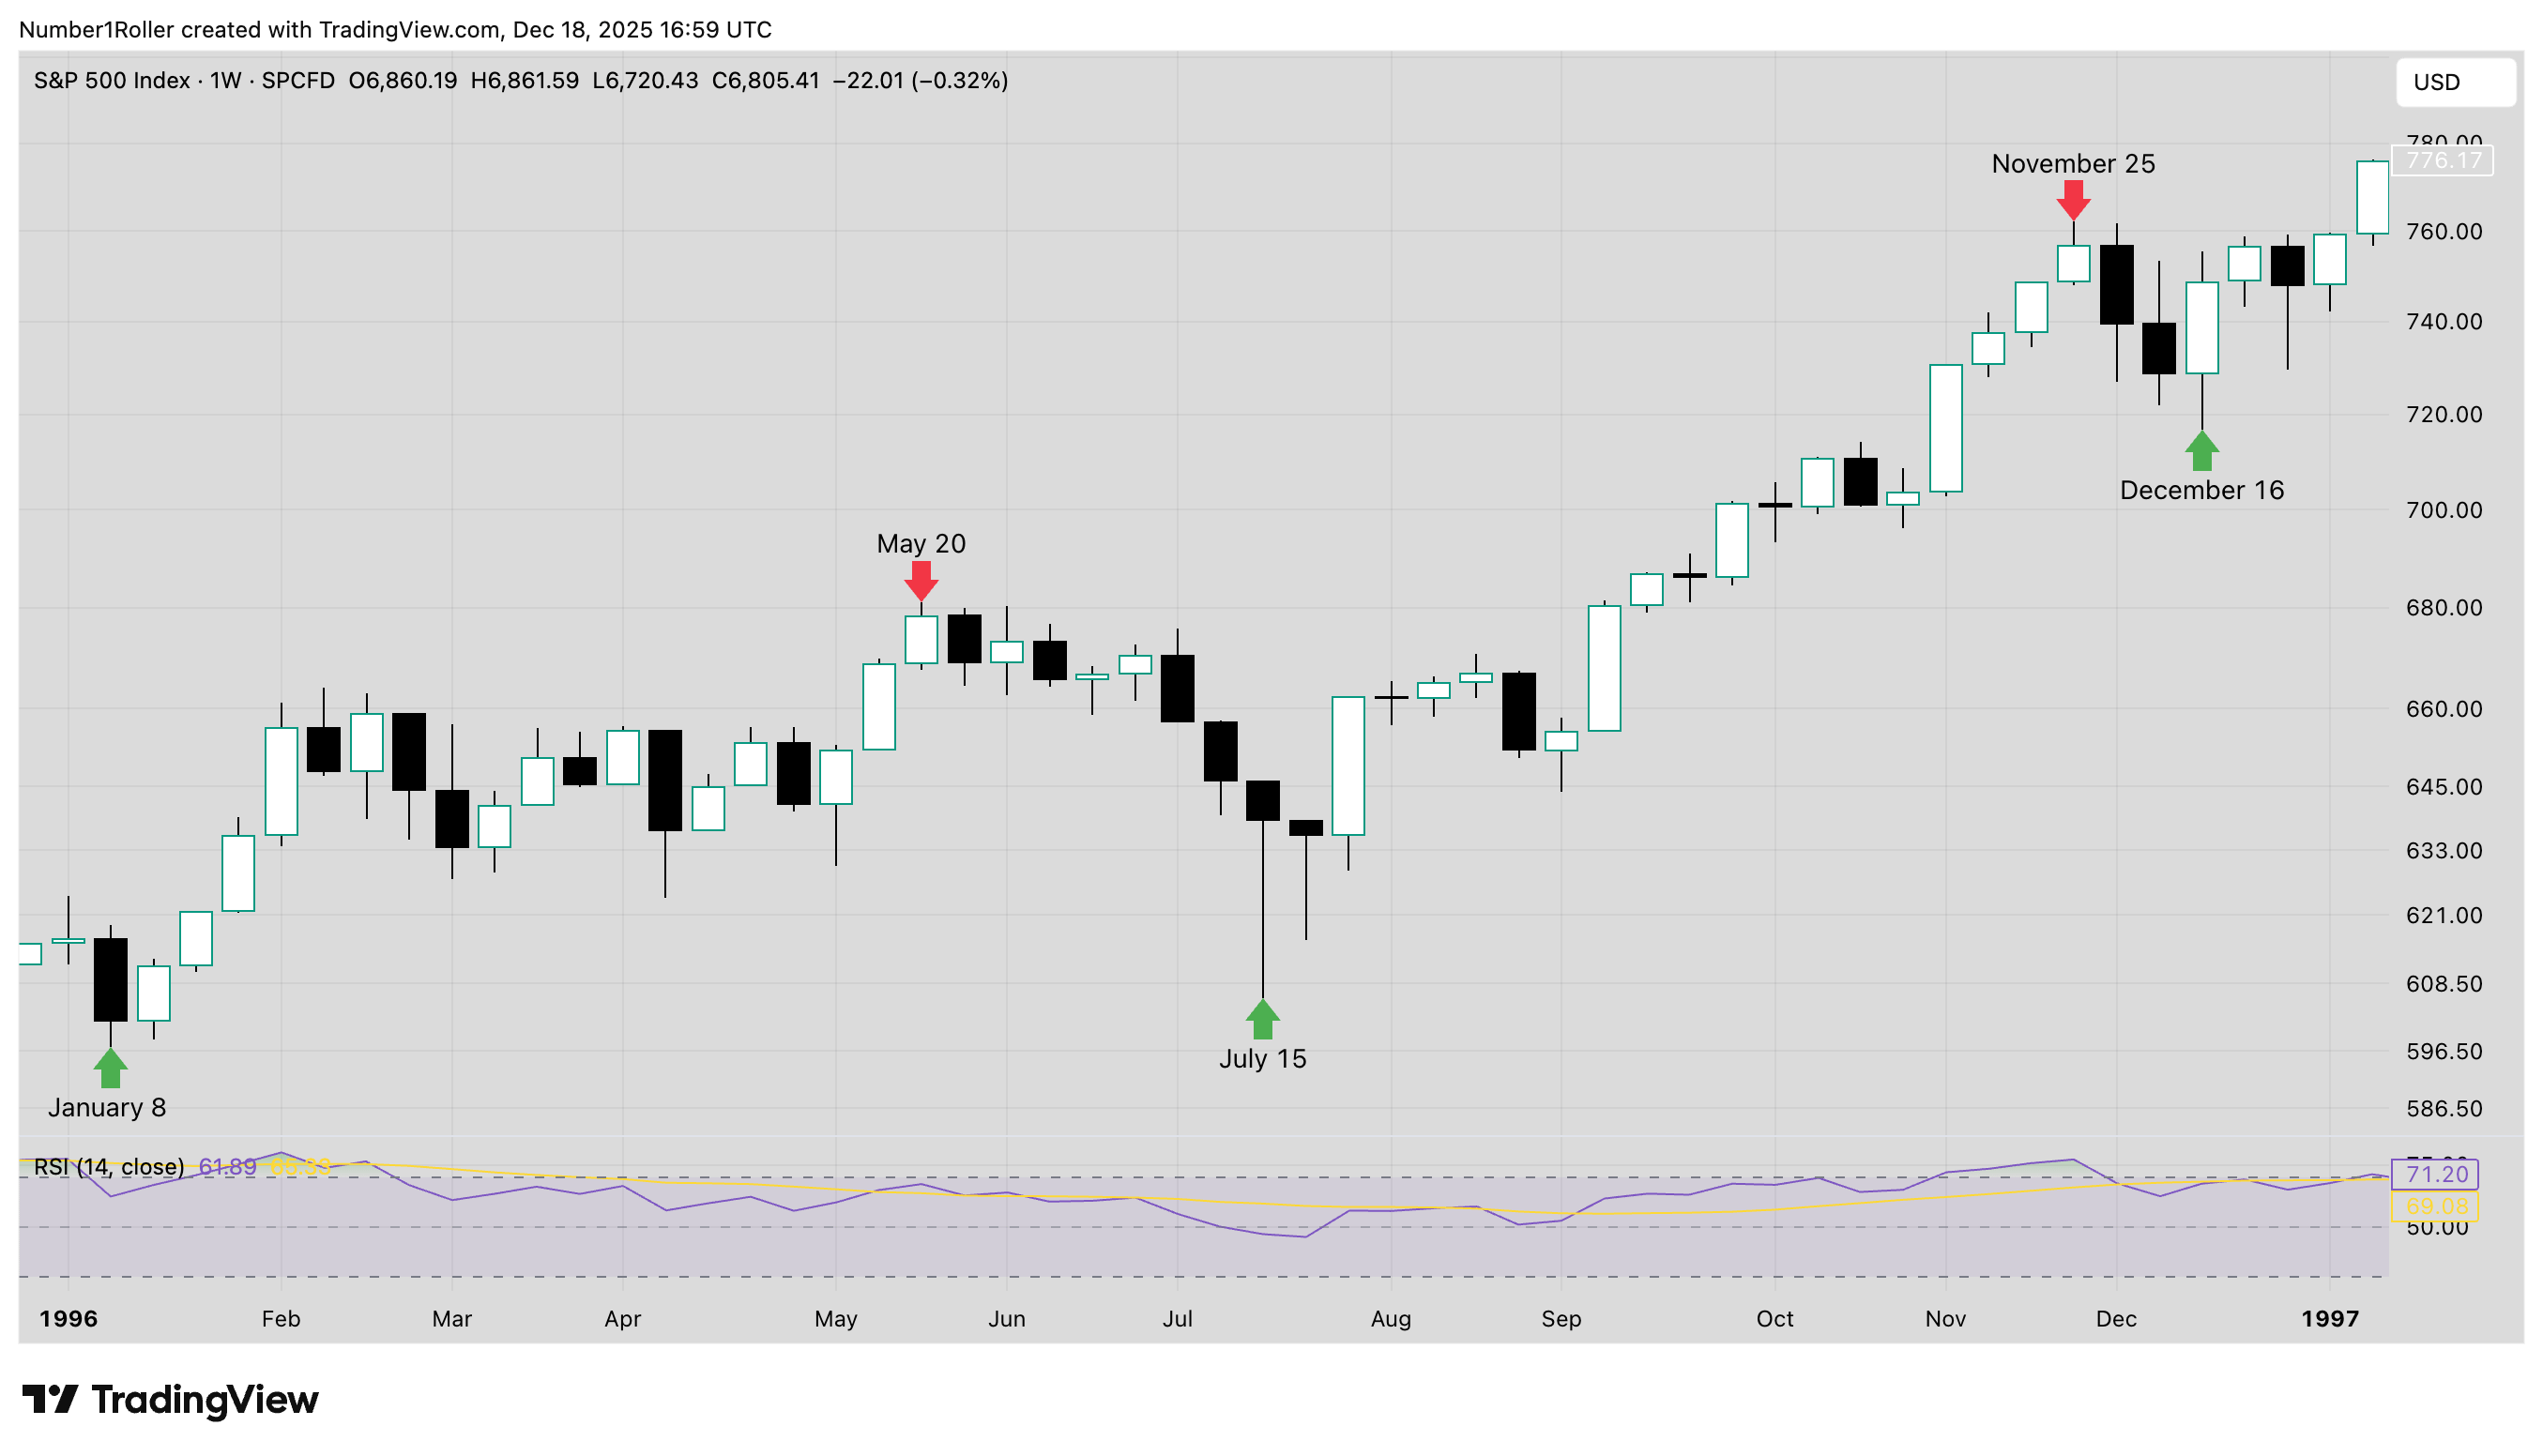
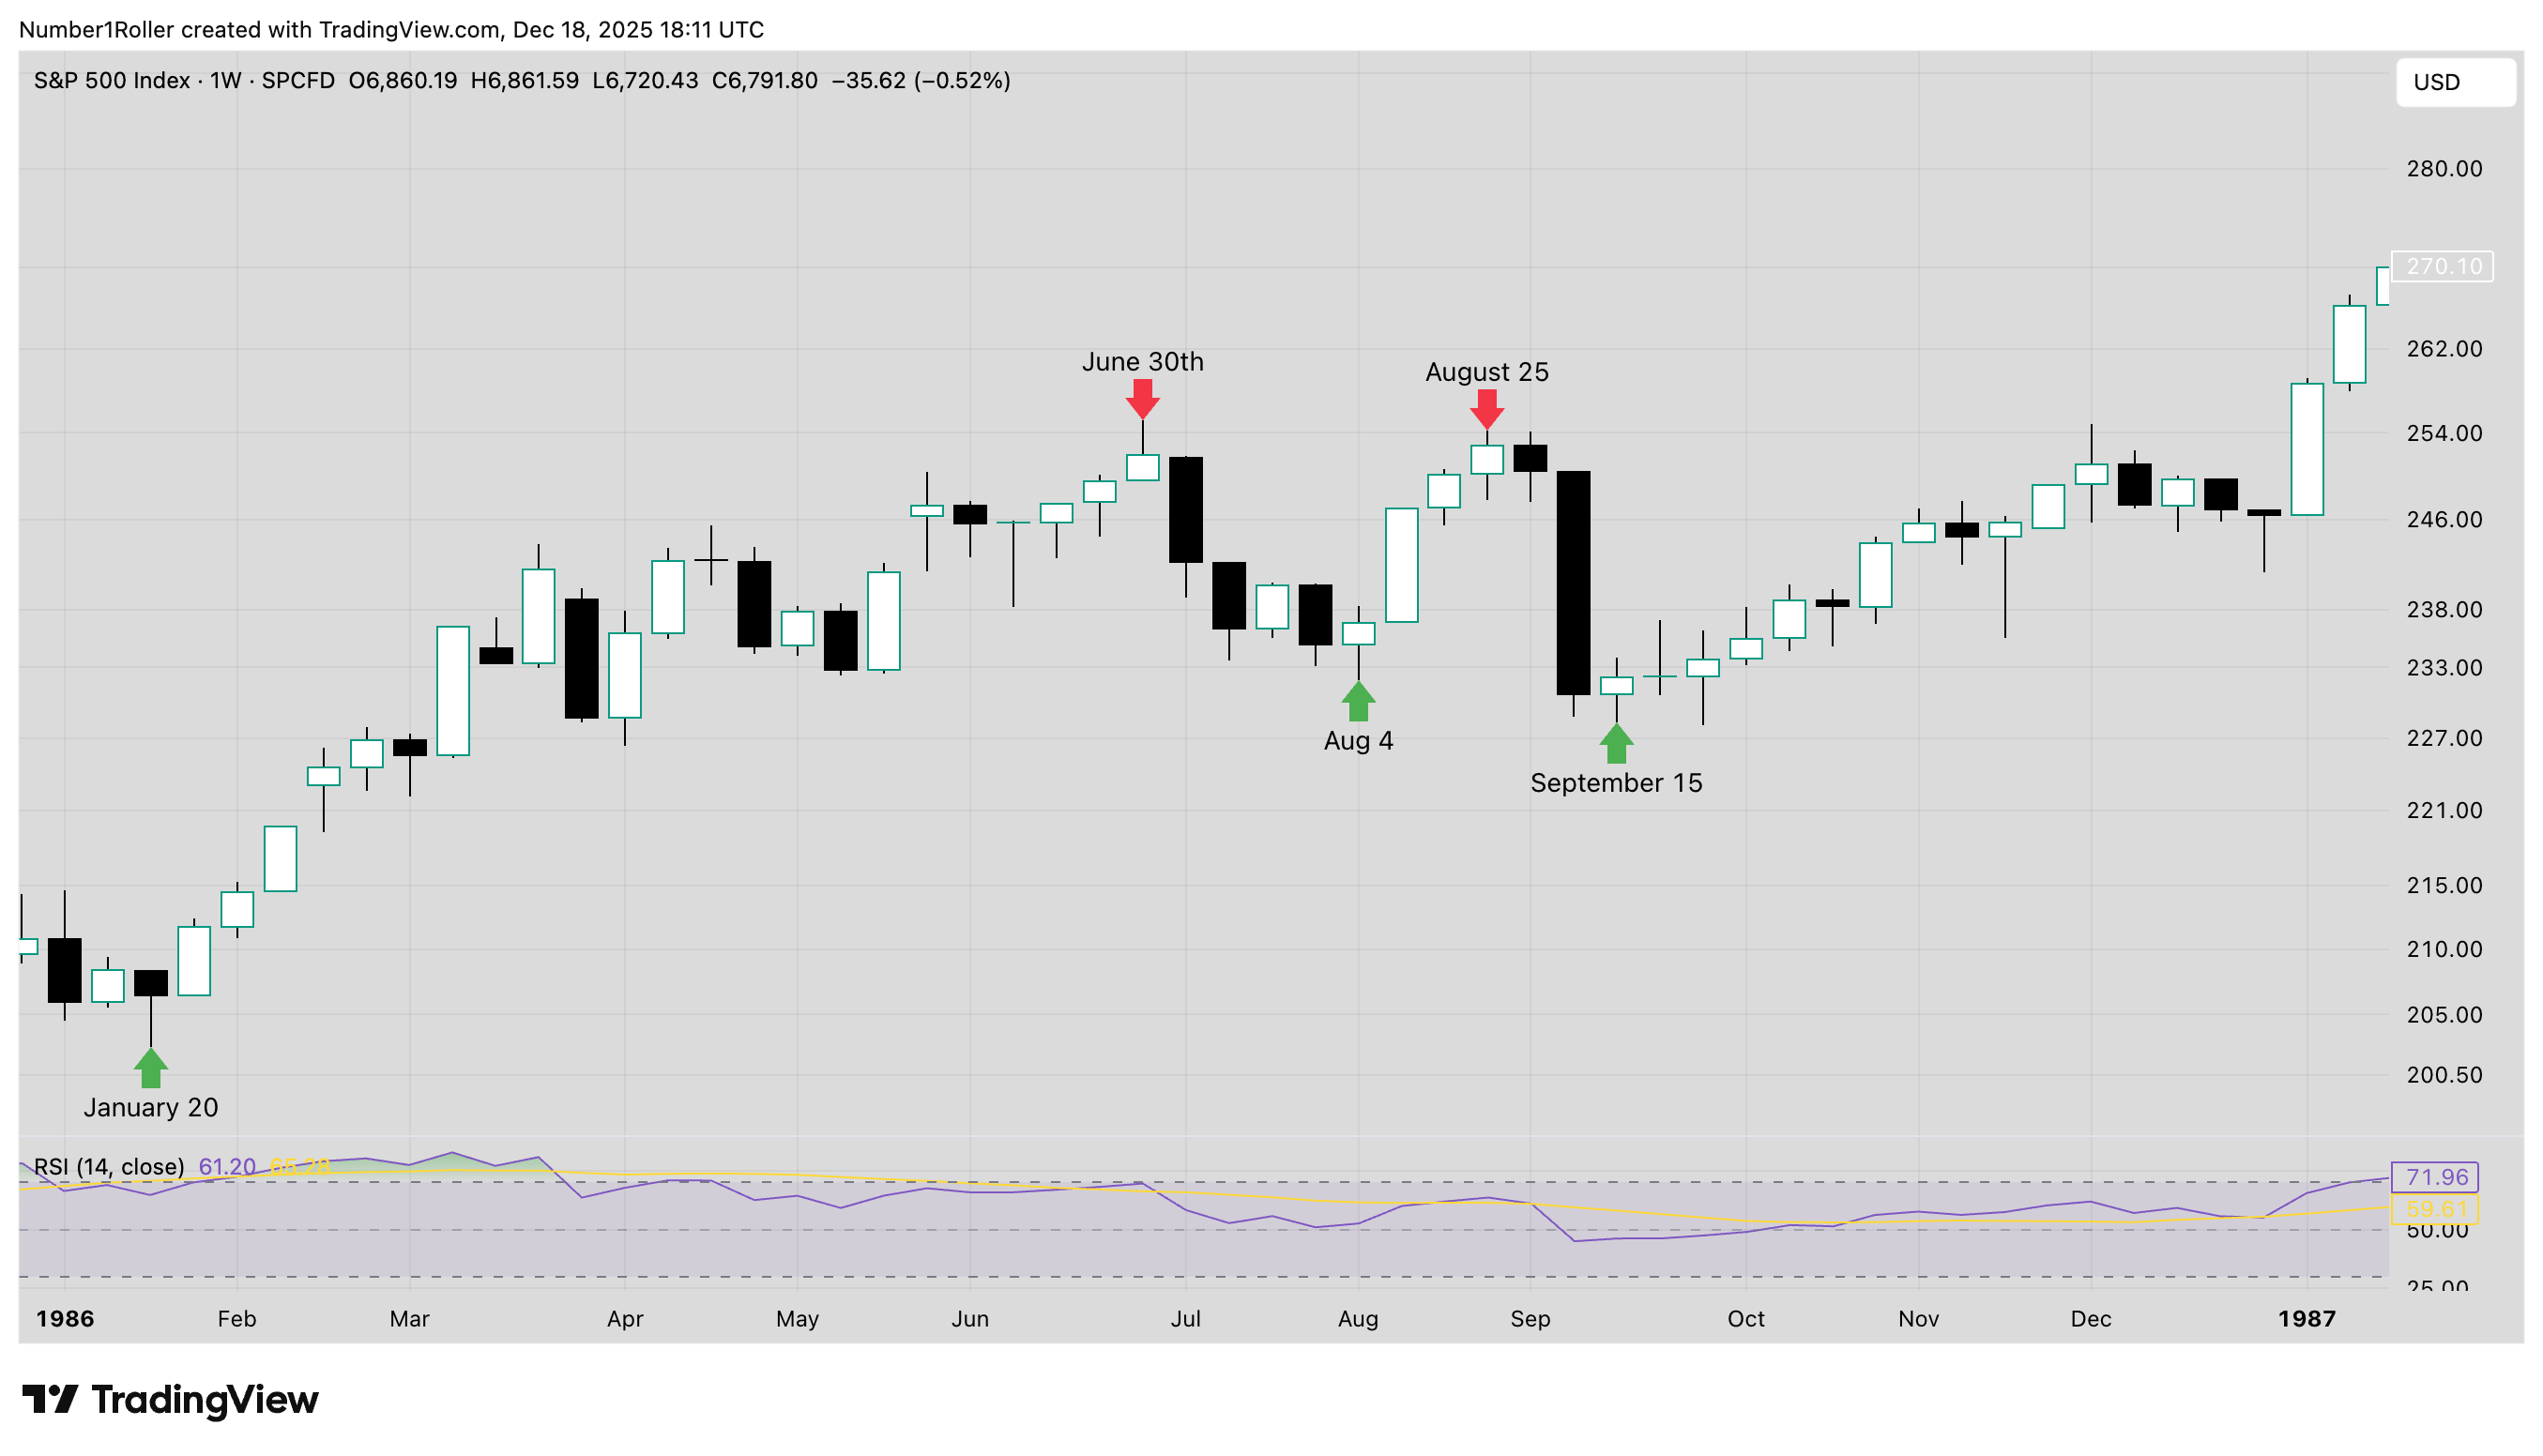
40 Year Cycle (1986 +16.86%)
50 Year Cycle 1976 (+18.63%)
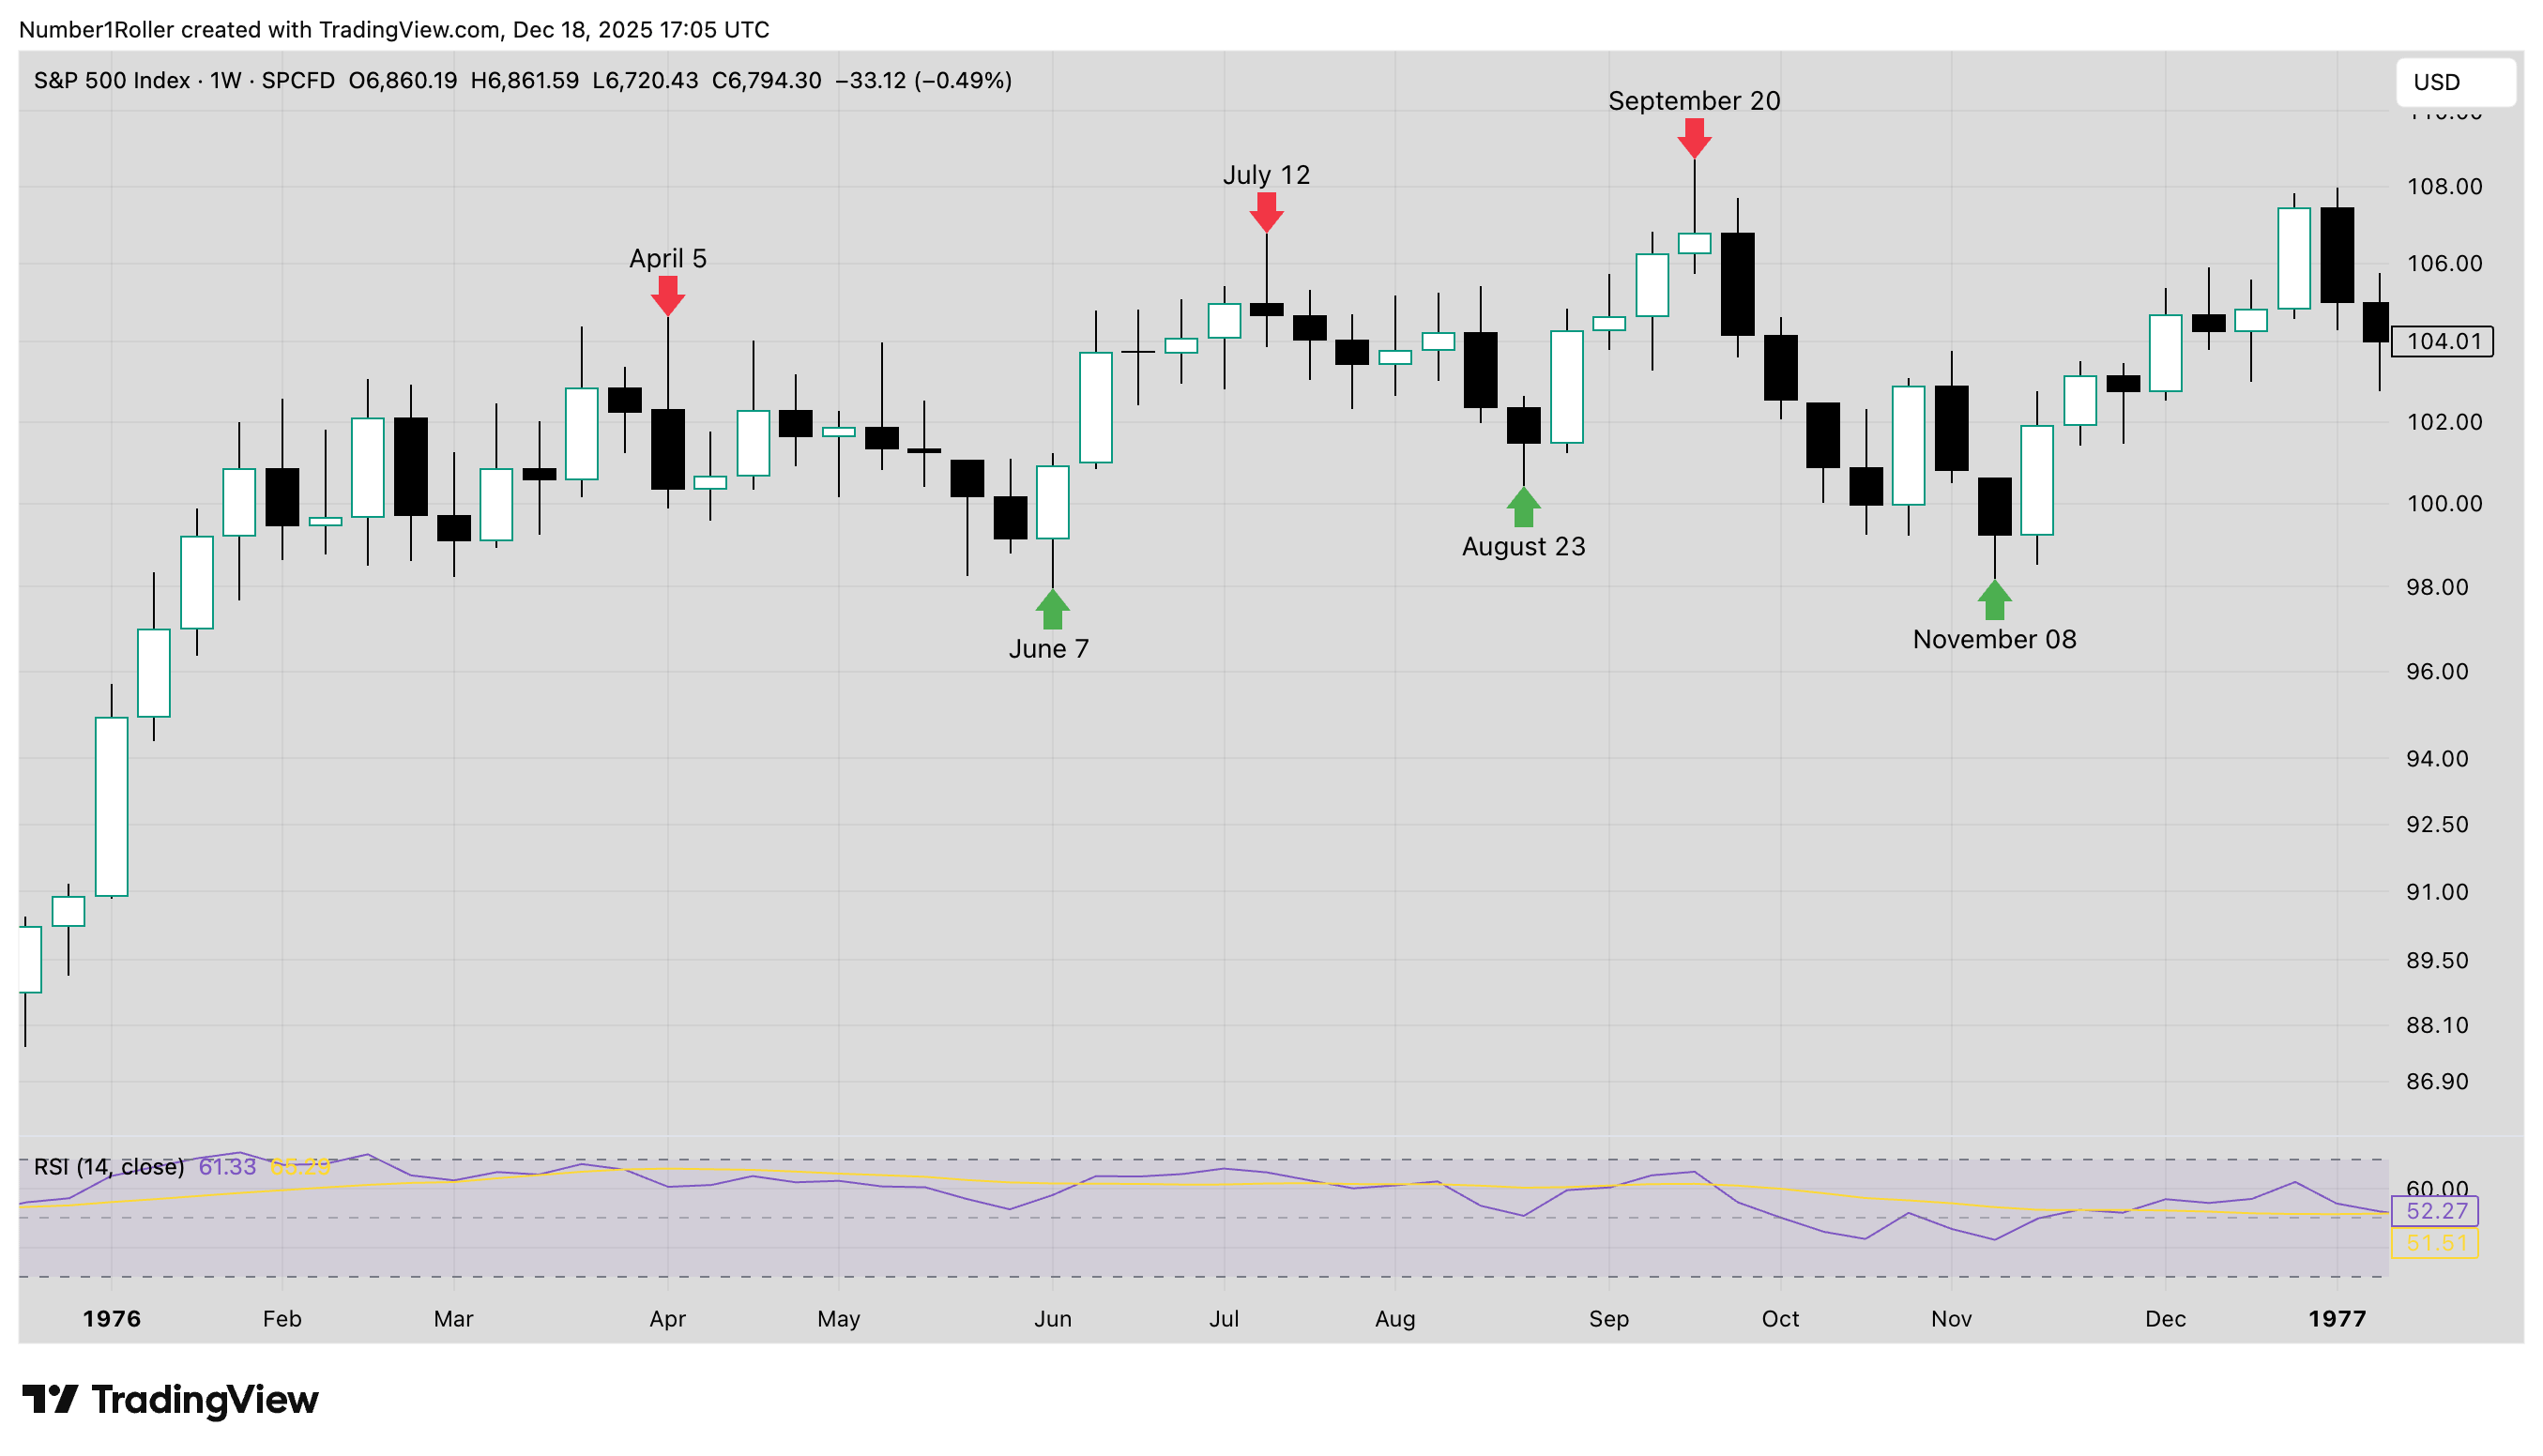
Looking at these cycles together you can arrive at some very common themes.
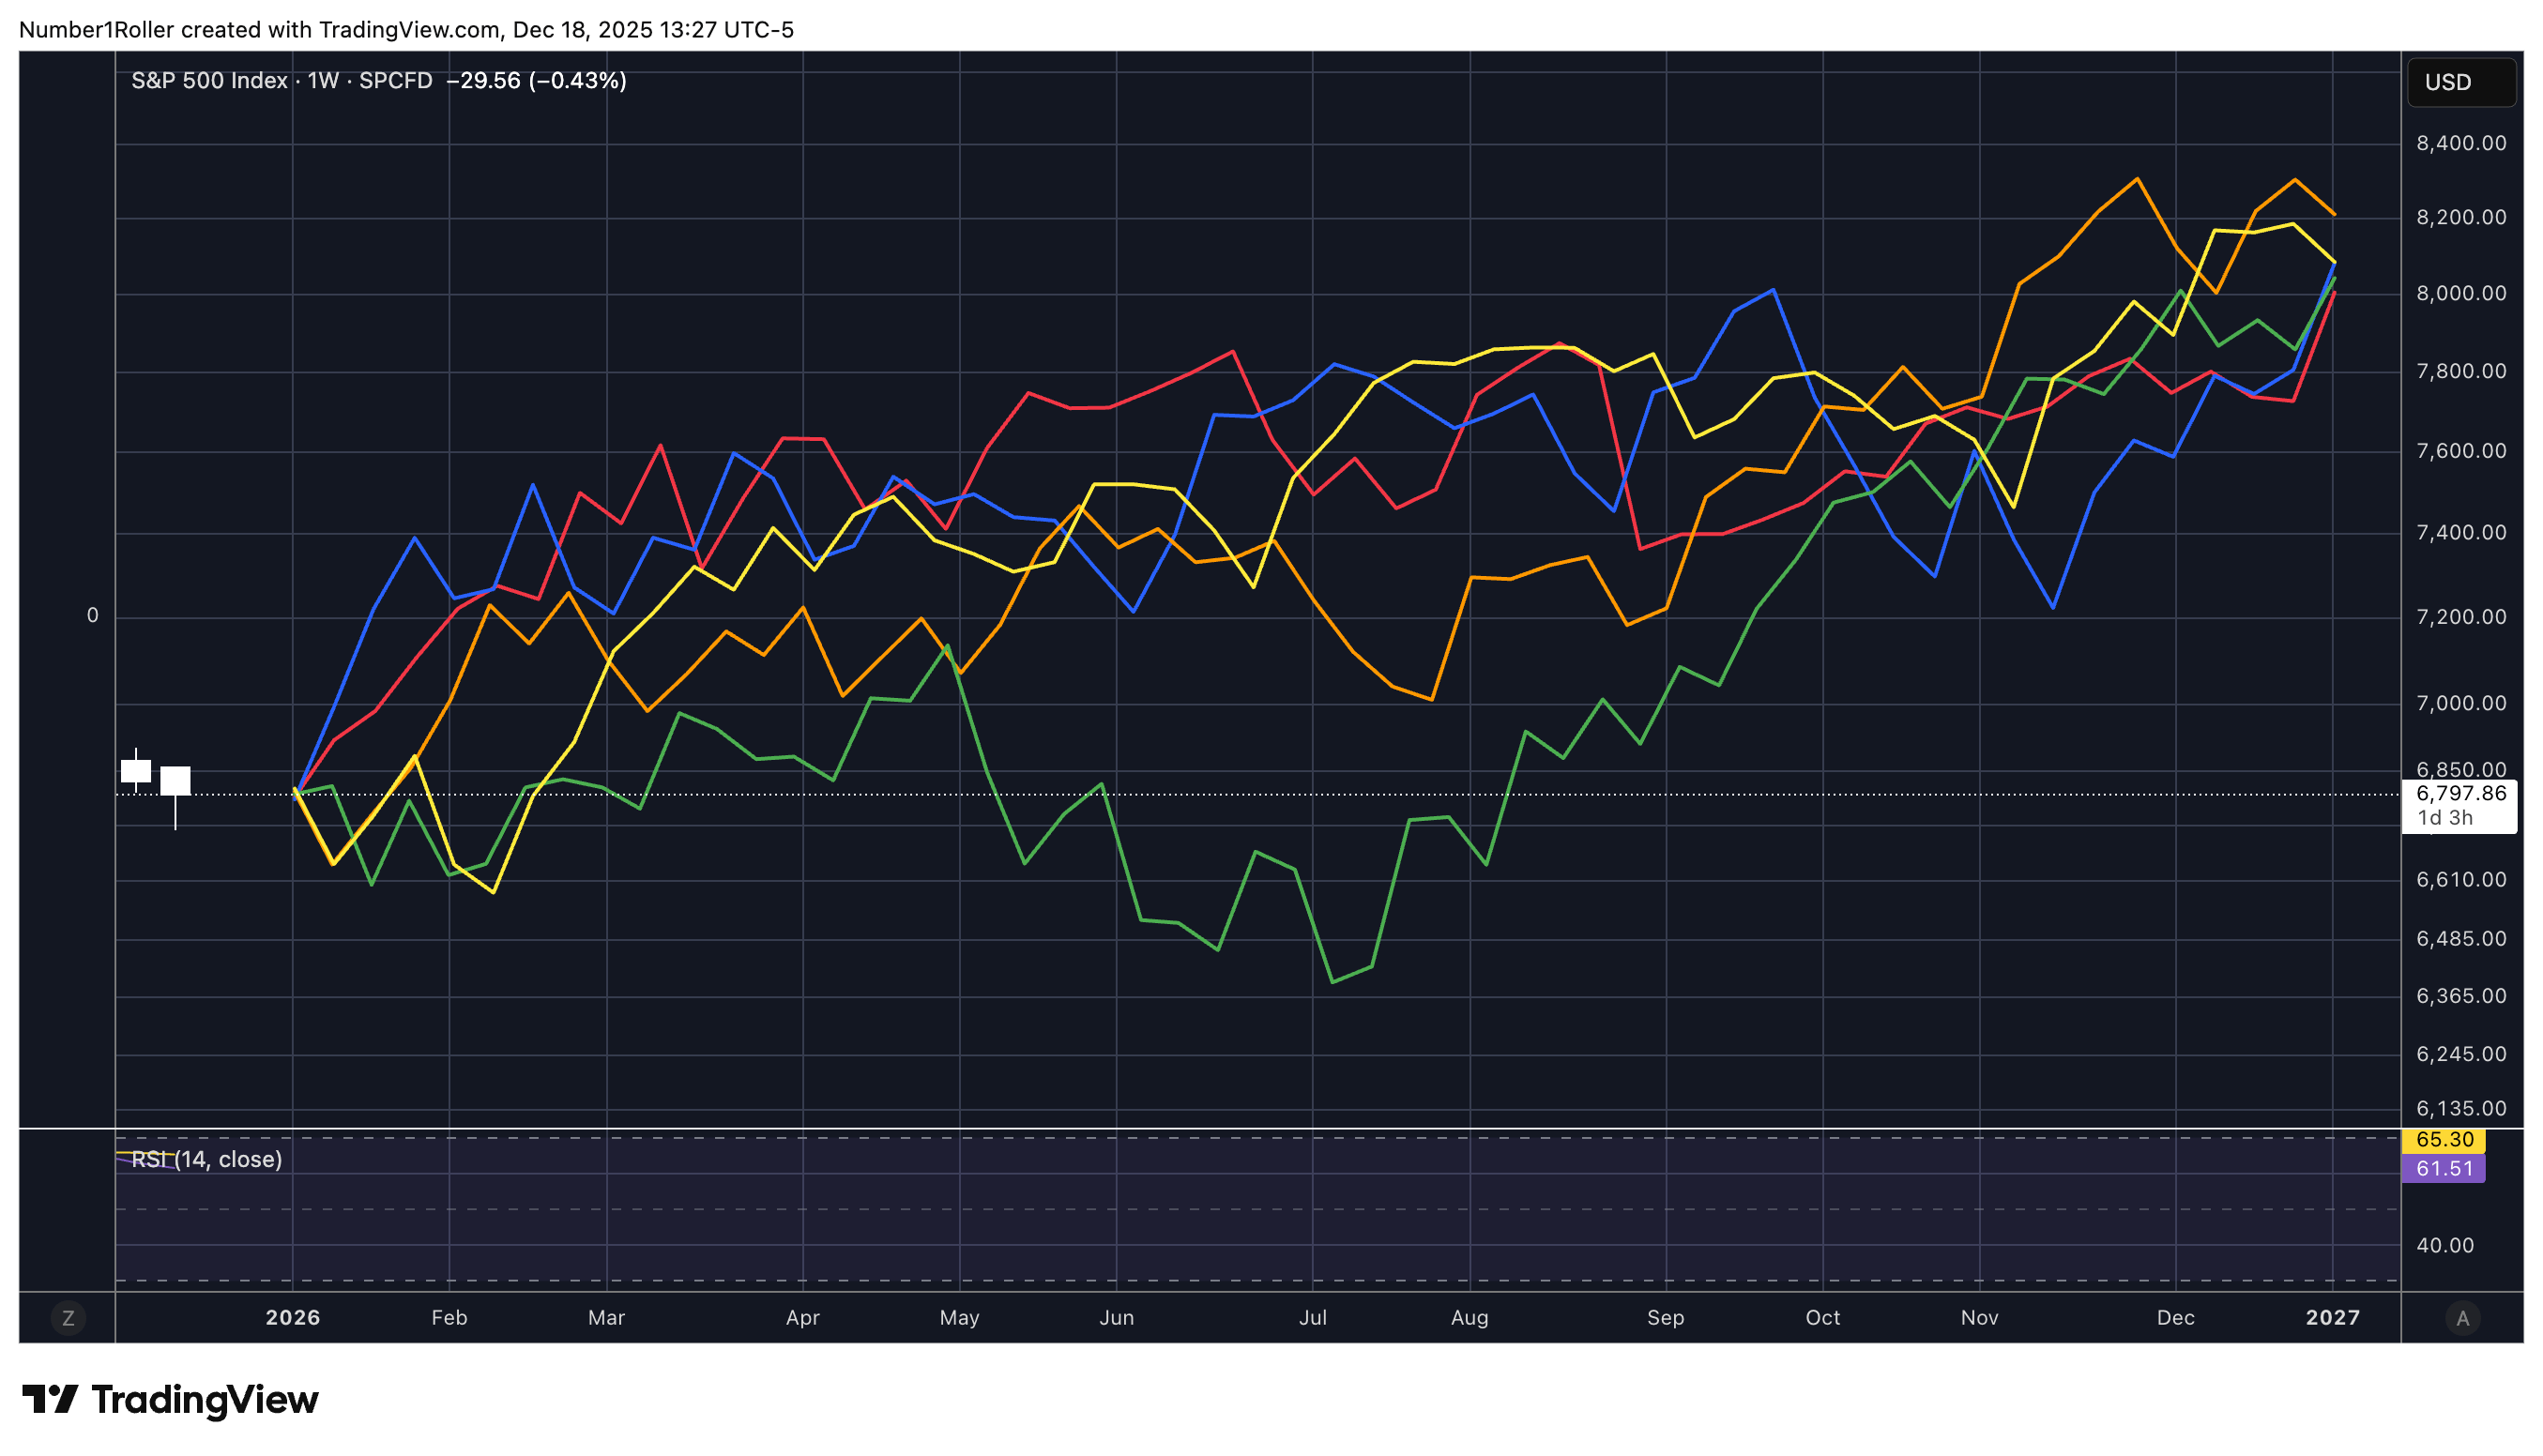
An immediate low early in the year (January)
An up move that flattens out around April to June
A May/June top followed by June/July low
and an August/September inflection point
On the whole these cycles very much align with Gann’s sixth year of the decade cycle shown above. The key takeaway is you get a big move up in Q1 a flat to down middle of the year and then a strong Q4 finish.
No matter how you slice it these cycles suggest an up year that grinds up rather than produces big moves like we saw in 2025.
I believe this will hold true based on what I’m seeing in the crypto cycles. My view is that the stock market will continue to climb the wall of worry in 2026 with more minor fluctuations and short term volatility rather than big swings. The most important point of the year will be right in the June/July window which suggests a sell off and bottom.
With a +15% return my price target will be around 7800 to 8000 for the S&P by year end.