

The Biggest Asymmetric Opportunity in Five Years
This is part three of a series where I’m laying out, step by step, why I believe this market is setting up for a major cyclical shift—and why the opportunity in front of us right now is being completely mispriced.
Most people think this has been a weak year for crypto. That’s a surface-level read.
What’s actually happened is far more important: the market has spent the last several months building structure, resetting positioning, and compressing in time while conditions quietly improve in the background.
We’ve been tracking this since January. Based on time, structure, and macro alignment.
And now, for the first time in five years, those three are starting to line up at the same time.
And that’s where the biggest asymmetric opportunities are created.
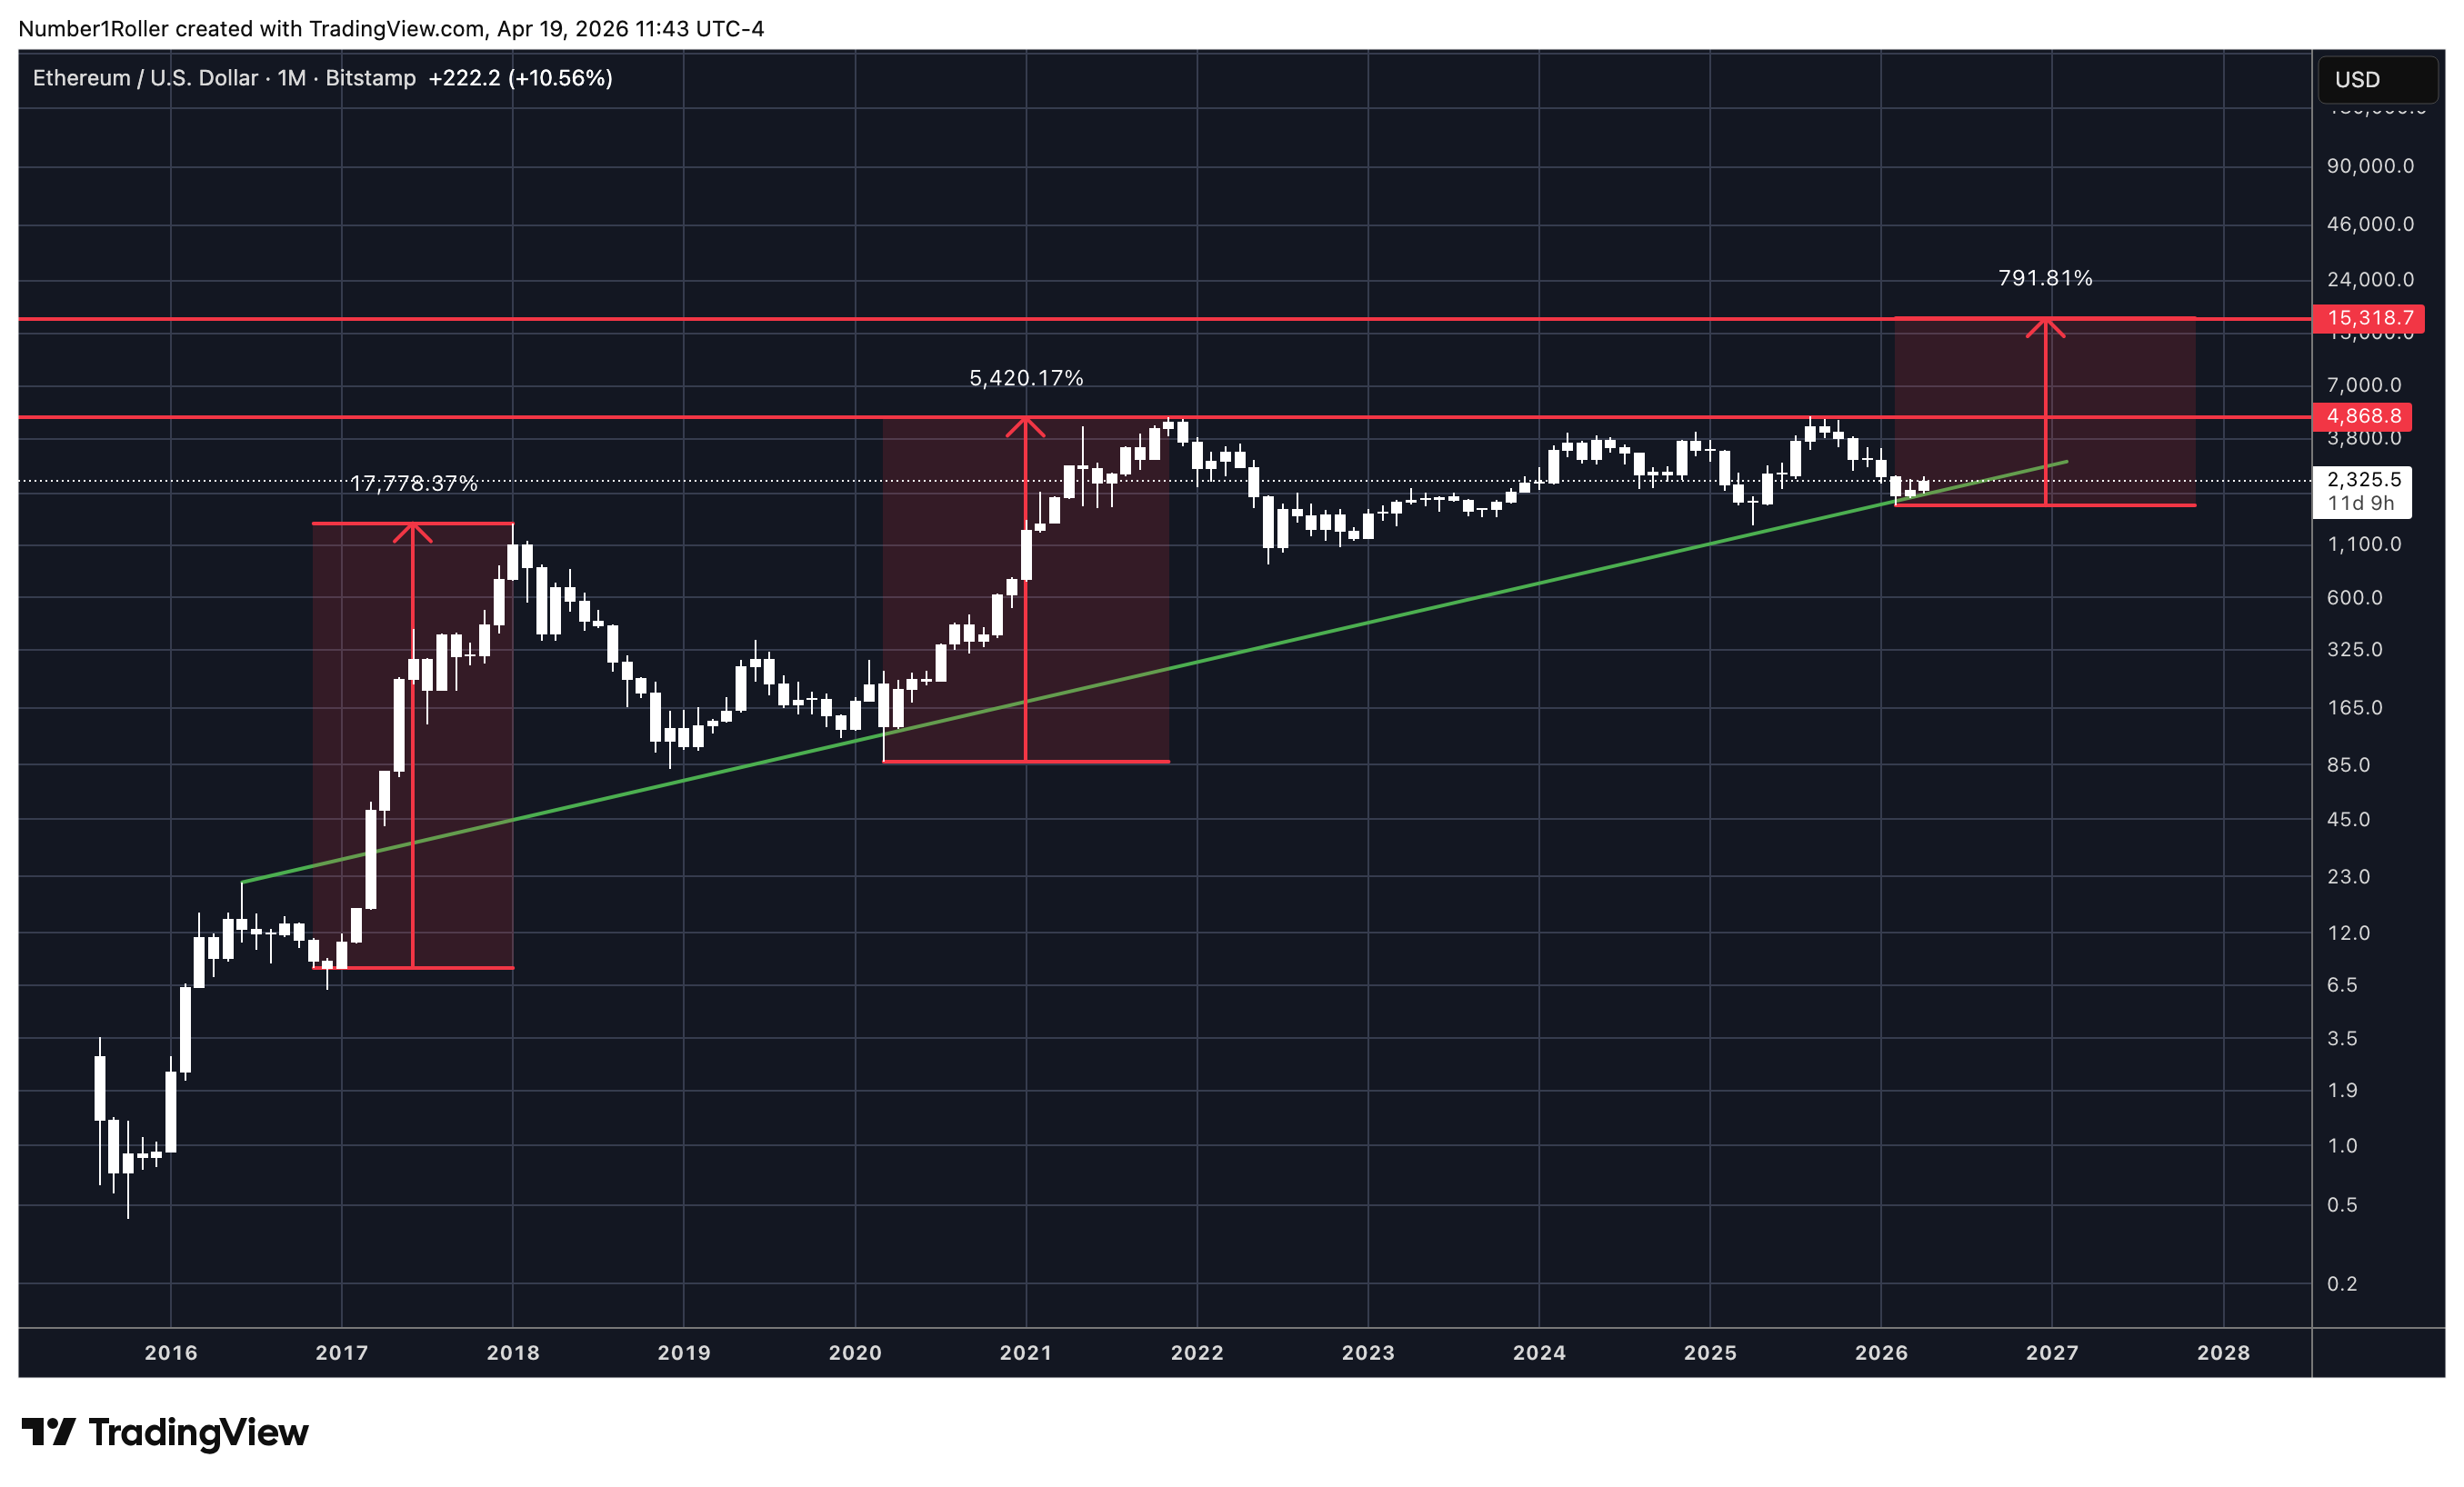
The Ethereum Structure: Same Setup, Bigger Scale
Starting with a chart I shared back in January. Ethereum has a remarkably consistent structural pattern across cycles — the time ranges keep expanding, but the structure is identical.
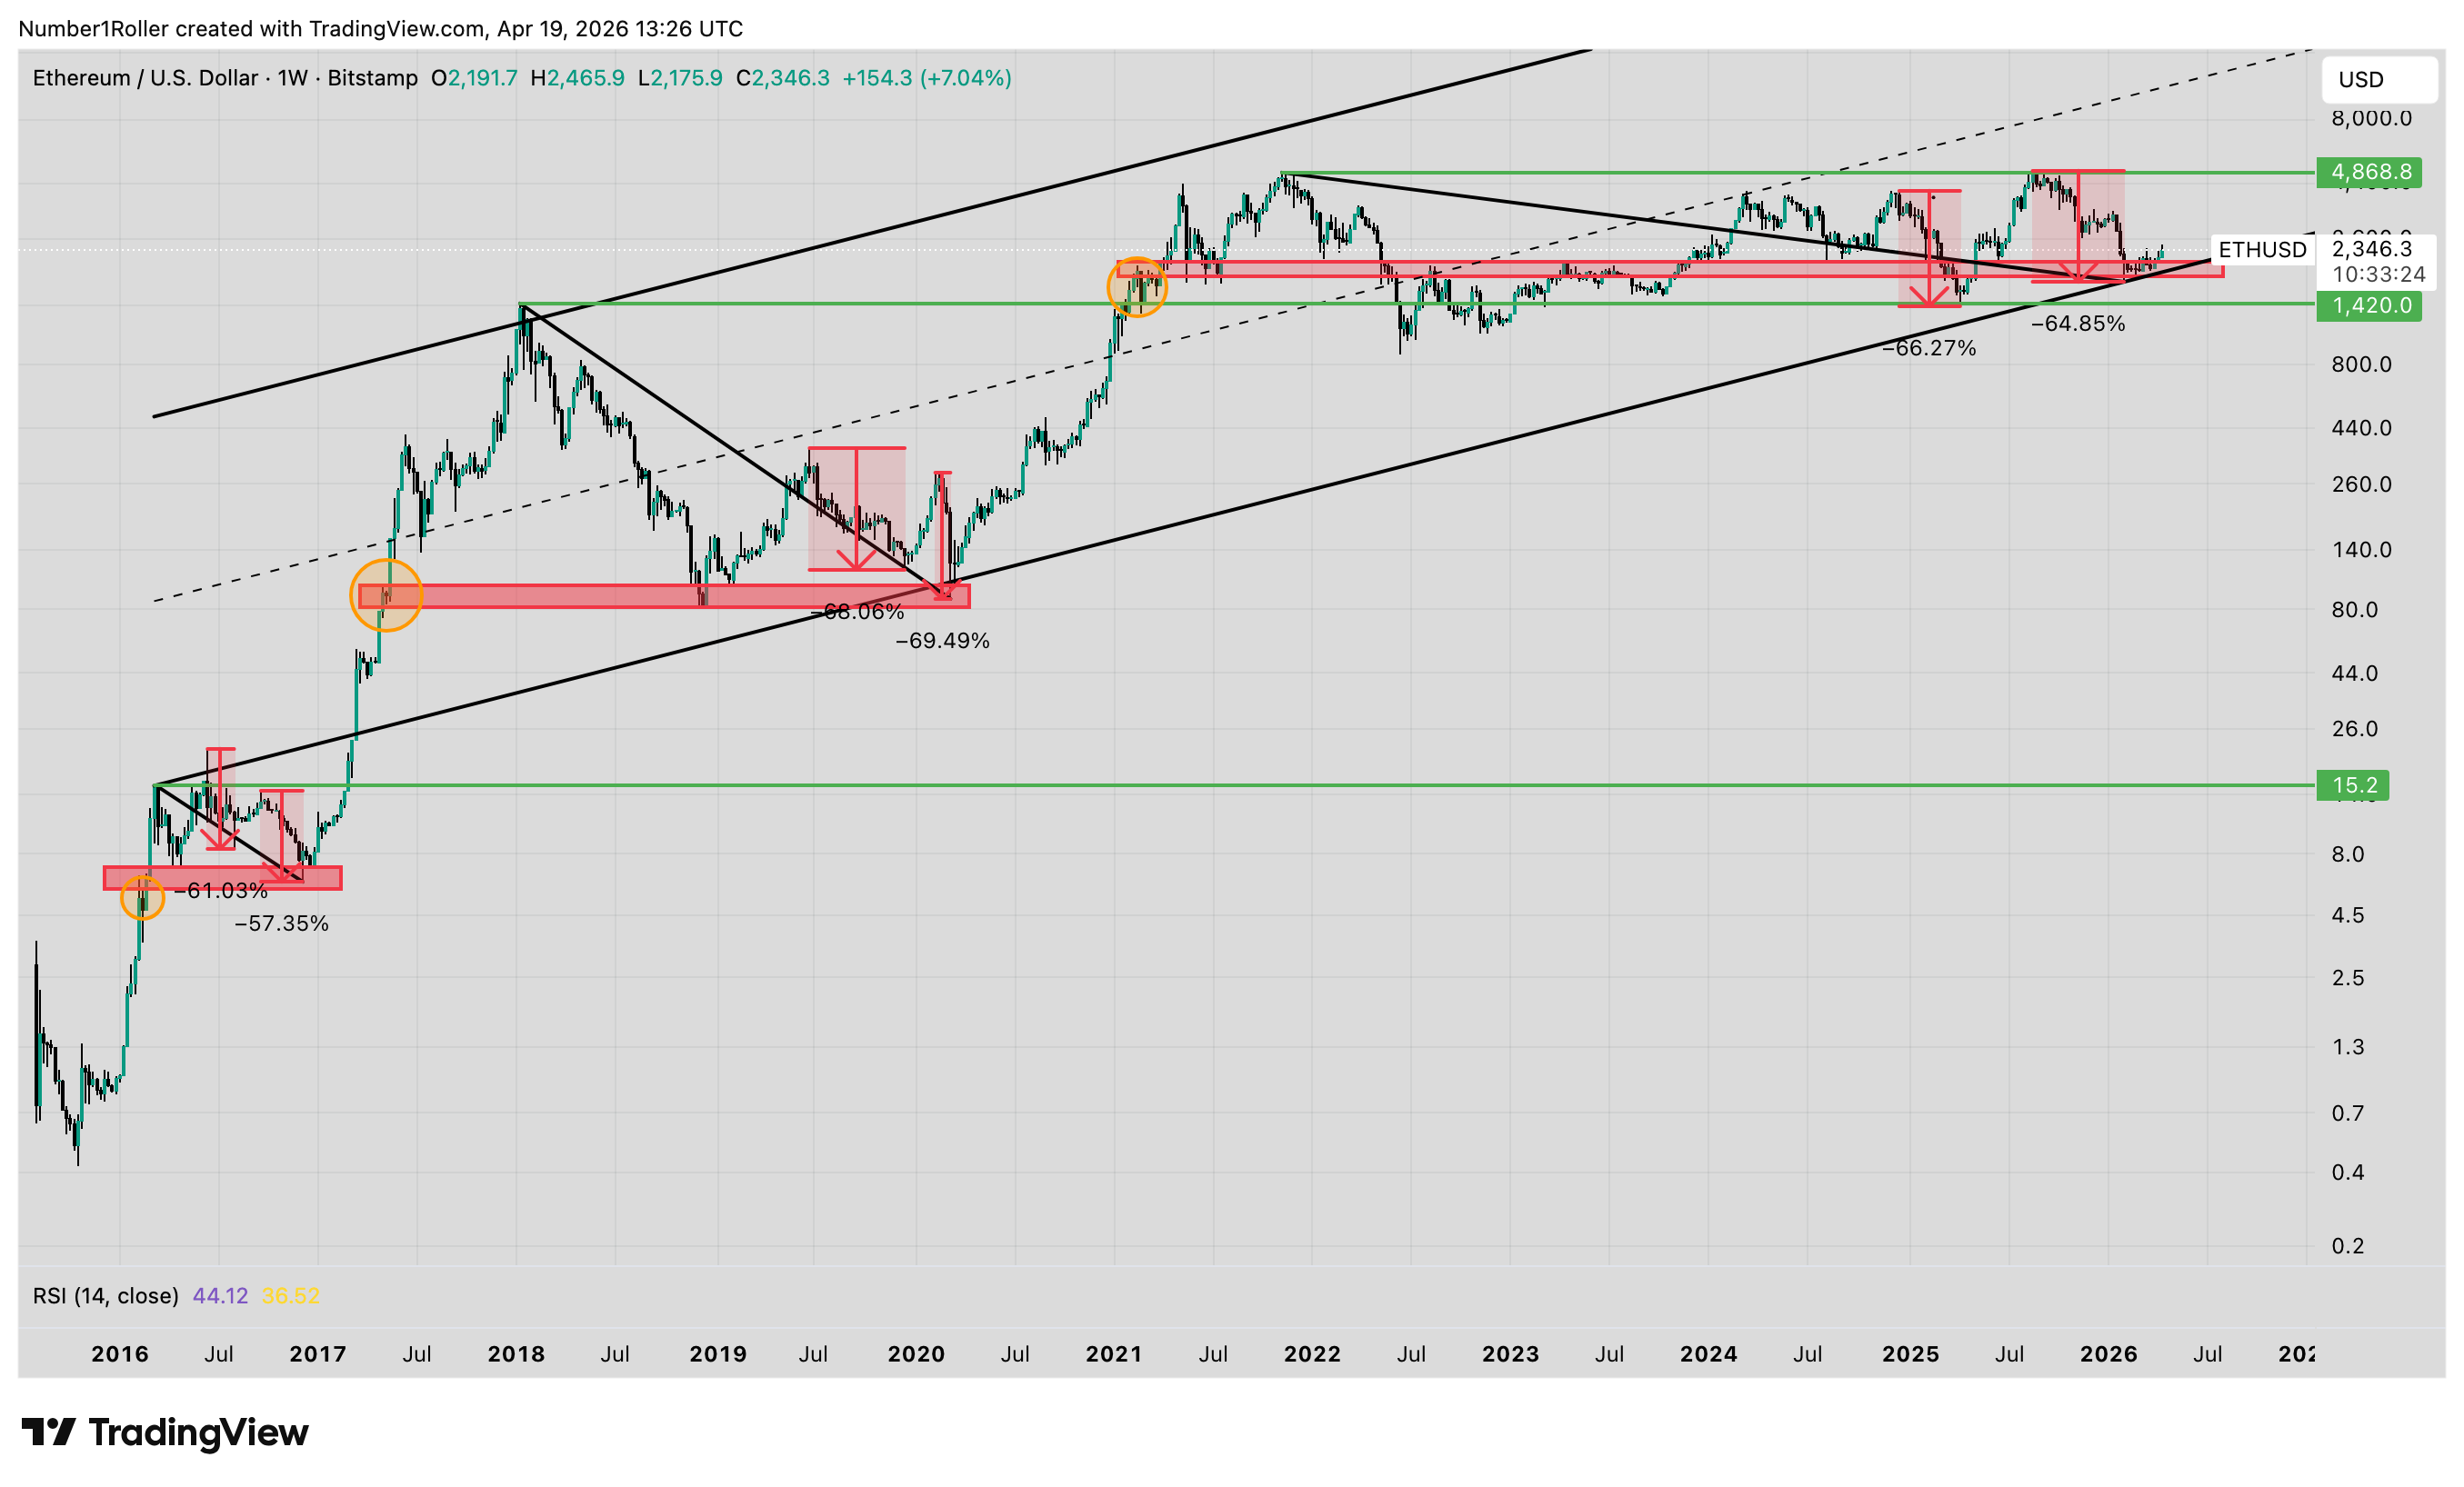
Each parabolic move has been preceded by the same footprint: a cycle demand zone formed by a liquidity gap from the previous parabolic rally, then the next parabolic move. Here’s what’s telling — before each of the two previous major bull runs, ETH printed two major cycle corrections before going off to the races:
2016 cycle: a 61% crash, then a ~60% secondary crash, then liftoff
2020 cycle: a 66% crash, then a ~70% crash into the COVID bottom, then liftoff
Today: a 66% crash, then a secondary 64% crash
Pattern wise, this is no different from the prior two structural moves. The only difference is that the entire cycle is getting bigger and longer.
Bitcoin Dominance: Late-Stage Rotation
Now let’s overlay Bitcoin Dominance against ETH in a few charts to look at the structural setup headed into this major cyclical rotation period.
The last cycle, BTC Dominance peaked, went through a ~52-week drawdown, then rallied into 70 weeks to a blow-off top. During that run, ETH traded absolutely nowhere for 43 weeks — today its in a similar pattern.
In the chart below, we're now 43 weeks off the BTC.D top and ETH has traded exactly flat the entire stretch. Same behavior we saw 43 weeks off the top of BTC.D last cycle — ETH sat flat before ripping into a major bull move.
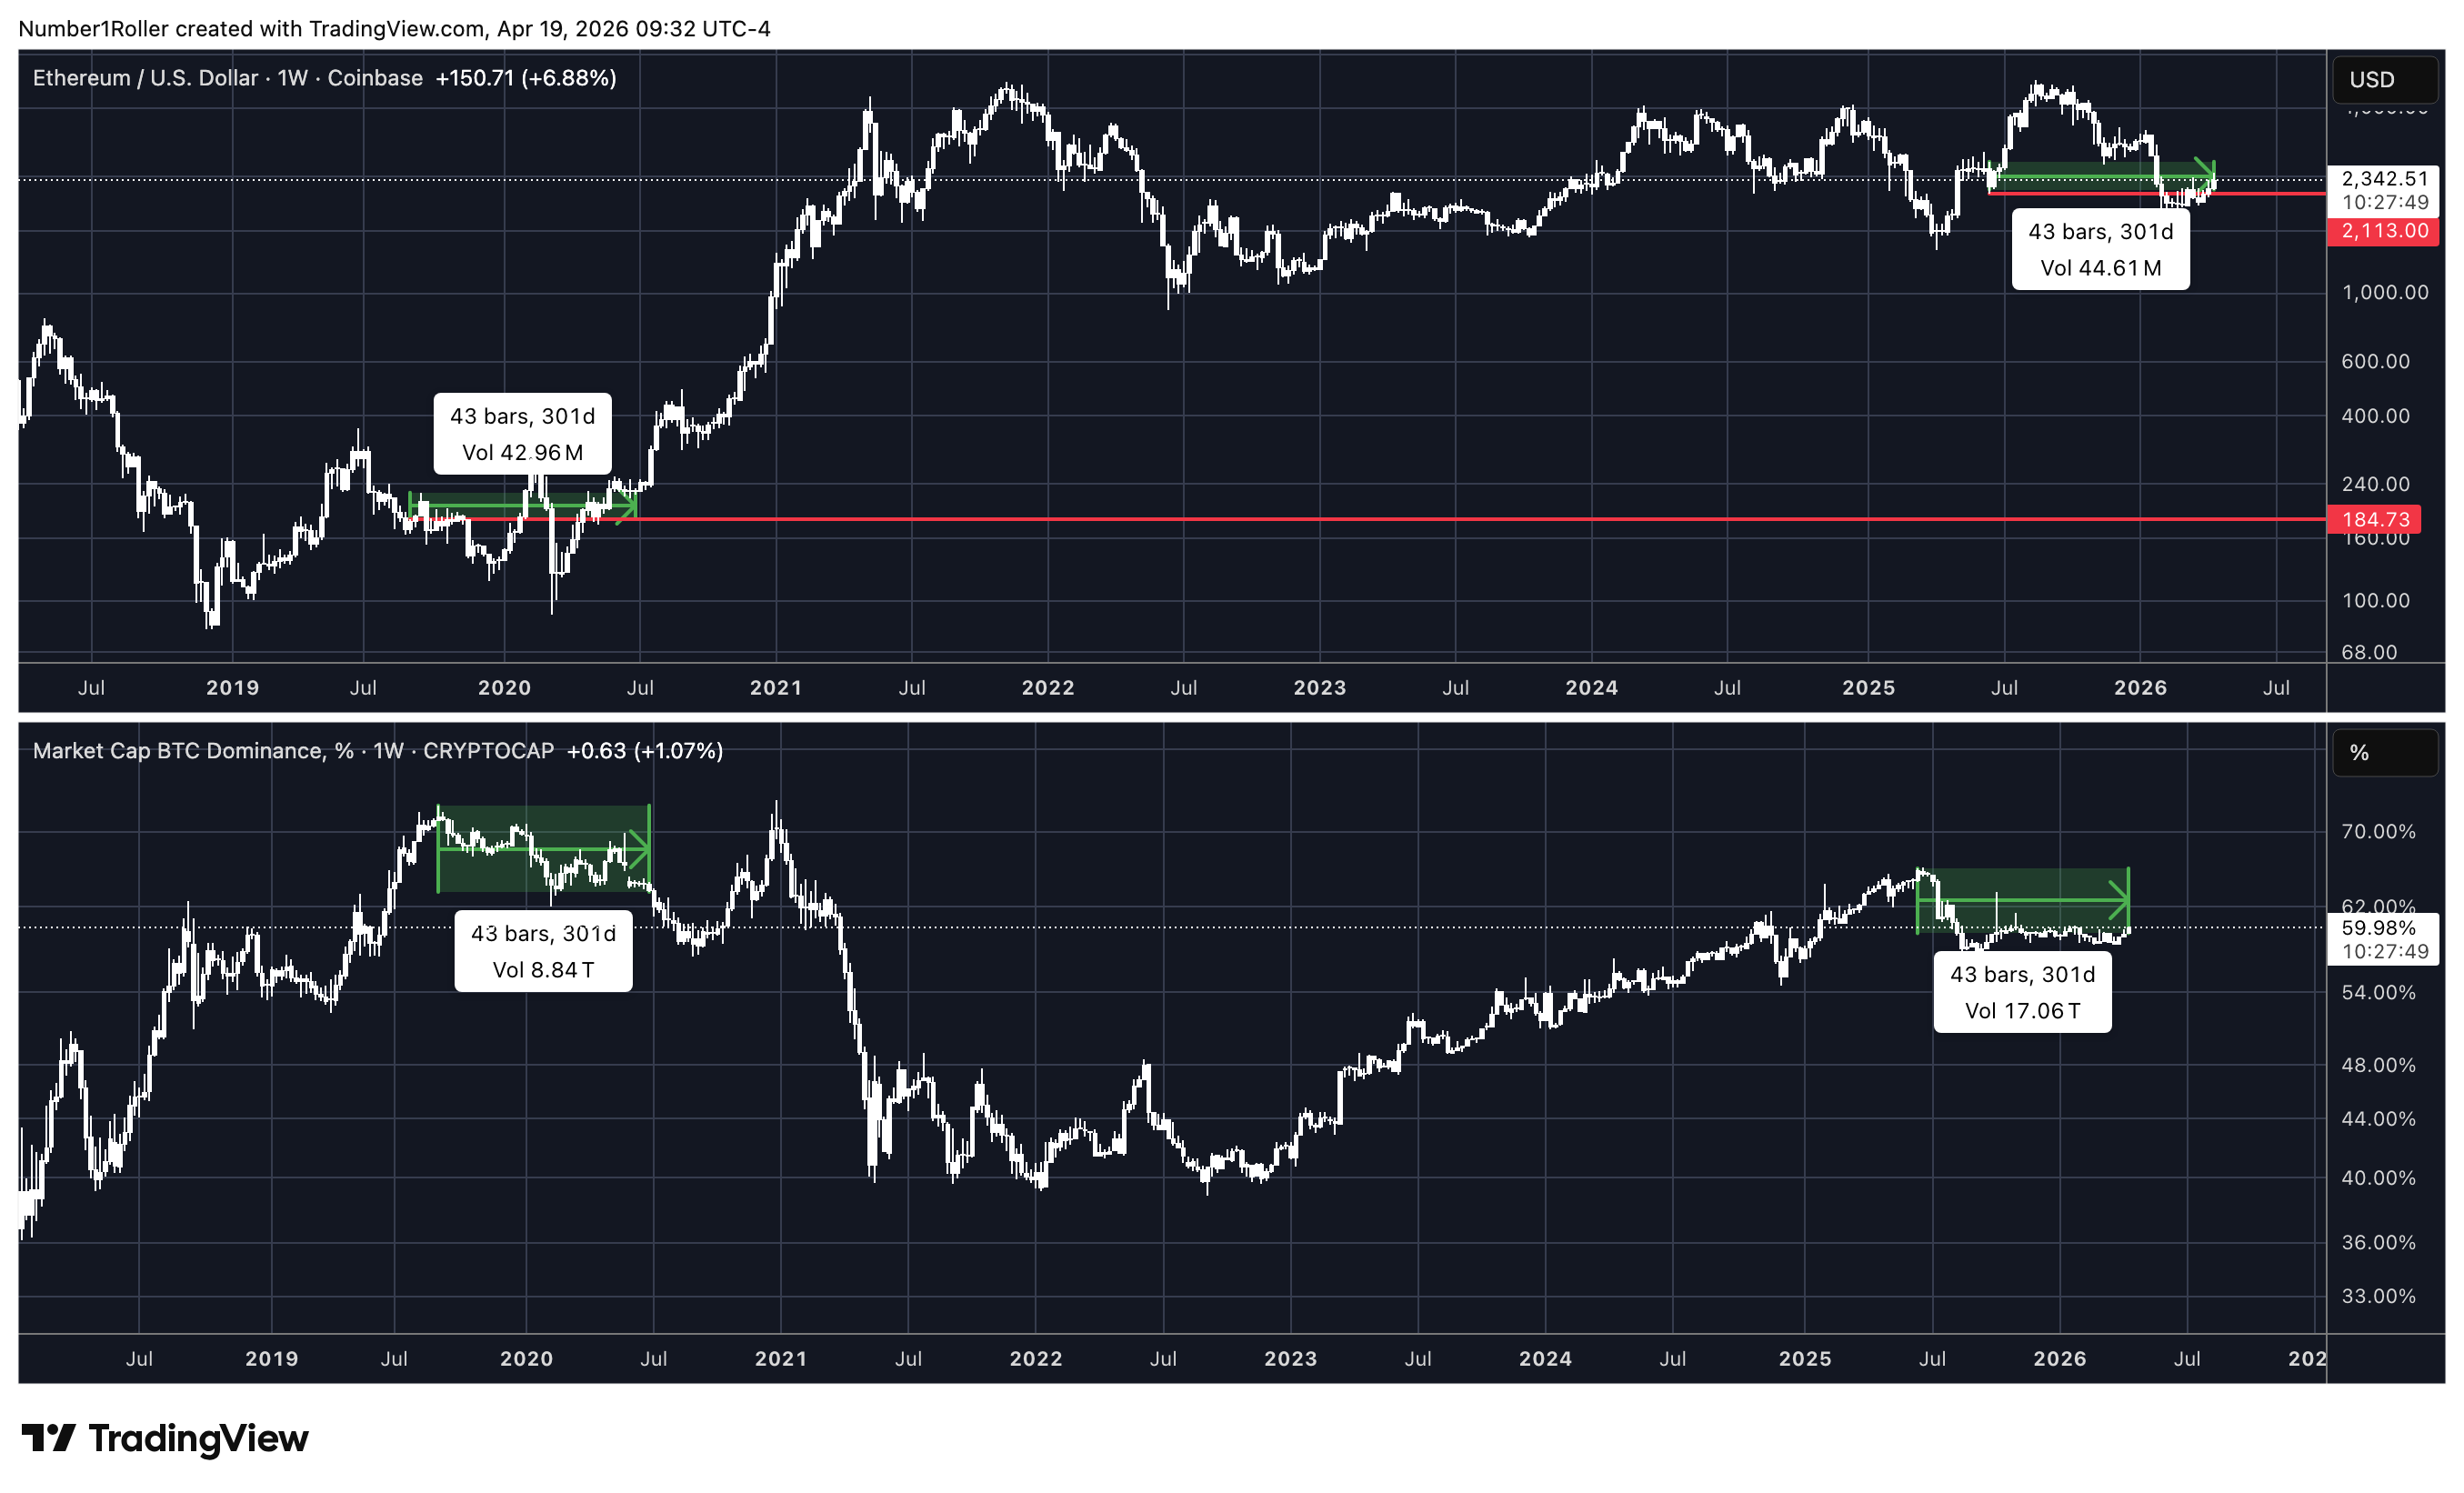
Next looking at BTC.D (inverted in blue) in the same chart as ETH again highlighting the recent 43 week move in the red boxes to show the comparable setup. You can see ETH structure has been slowly forming that base while BTC.D went up and it was right around this time last cycle where BTC.D broke down and ETH went parabolic.
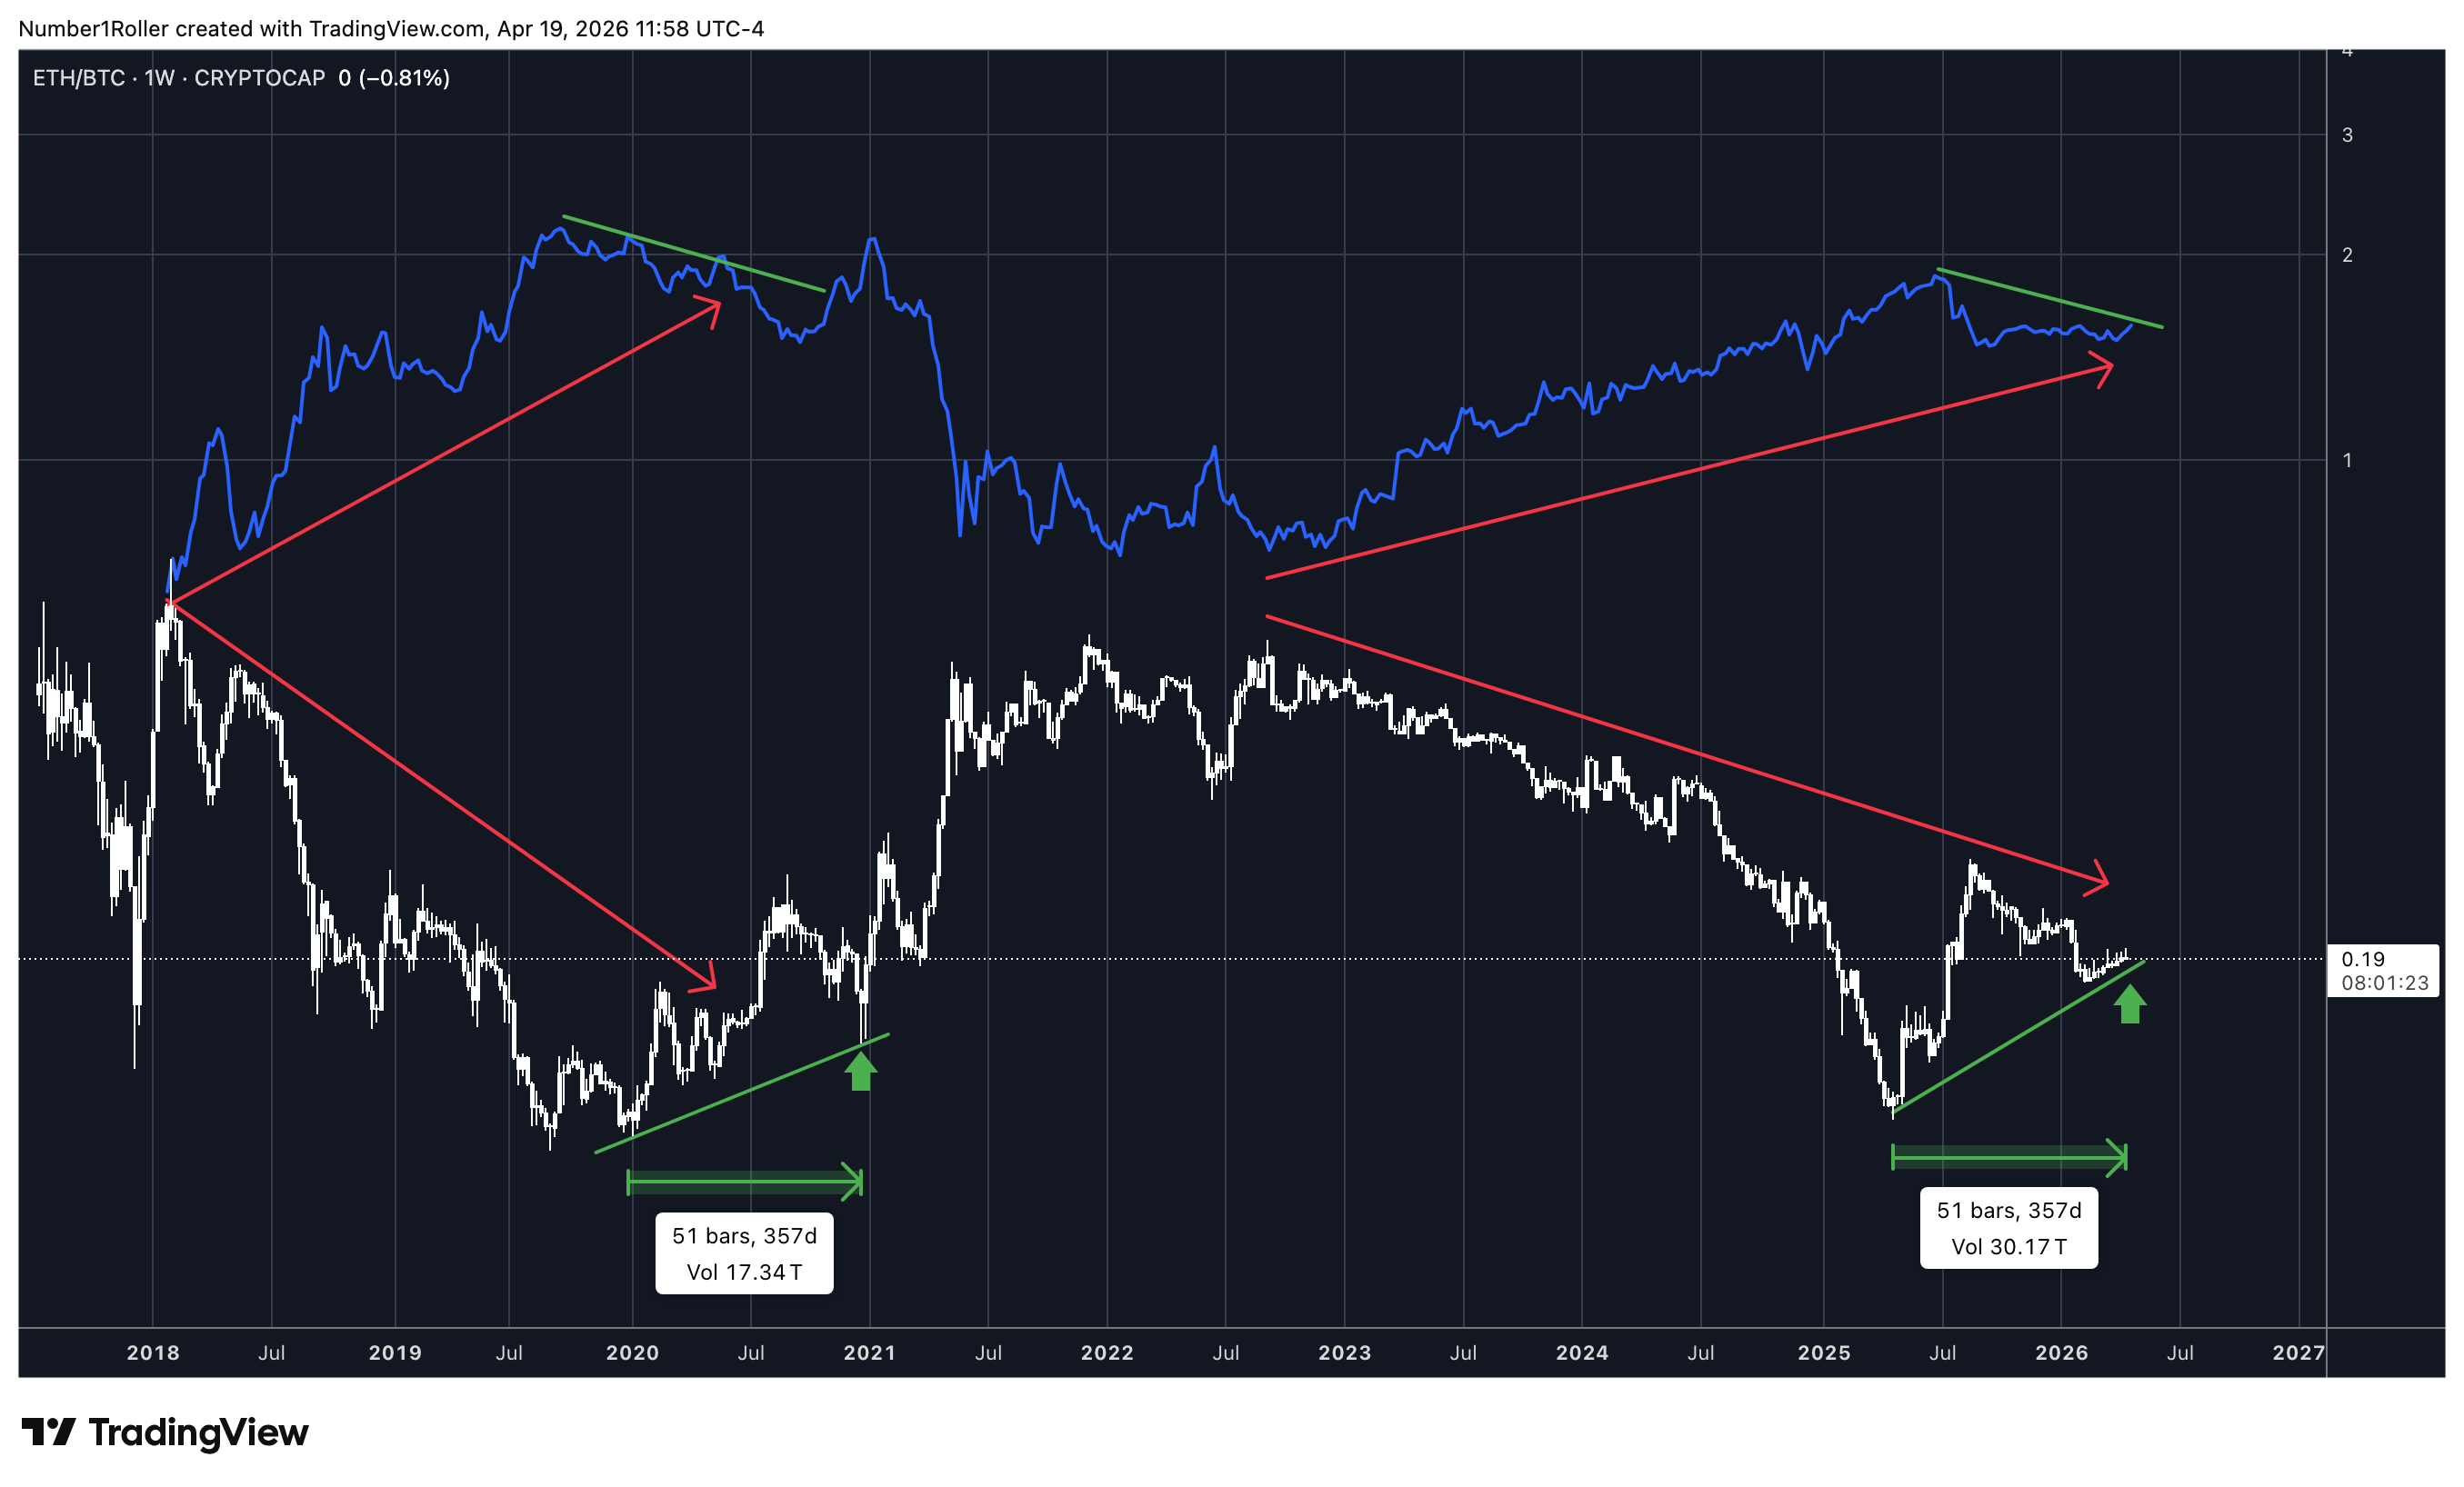
Finally, to paint the full picture look at this chart of BTC.D (blue) overlaid on the ETH/BTC chart. You see the pattern, big alligator jaws formation. Divergence begins forming (green lines) and the timing is nearly the exact same 51 weeks to the next major move up in ETH.
BTC Dominance topped, and ETH is now 43 weeks into the exact same pattern against bitcoin that preceded the major bull market in alts last cycle.
Dominance can absolutely make another run higher — we haven’t cleared this double top yet, and that could extend into later this year. But remember: last cycle, 43 weeks of flat ETH is exactly when alts started to move. By the time Dominance clearly tops, ETH had already run +300%. At this point, you don’t want to be in Bitcoin.
The Broader Macro Backdrop
This isn’t just a crypto setup. The conditions are showing up across risk assets. Something we initially wrote about in January but it’s time to see how those same conditions are shaping up.
Small Caps, Consumer Behavior, and ISM
To give us a brief picture of the overall economic backdrop at the moment lets take a look at the three charts that define risk appetite, consumer behavior, and business activity. IWM, JETS, and ISM
Each red level with orange corresponding bubble in the charts below marks the level and time at which a major risk on move in cryptos began.
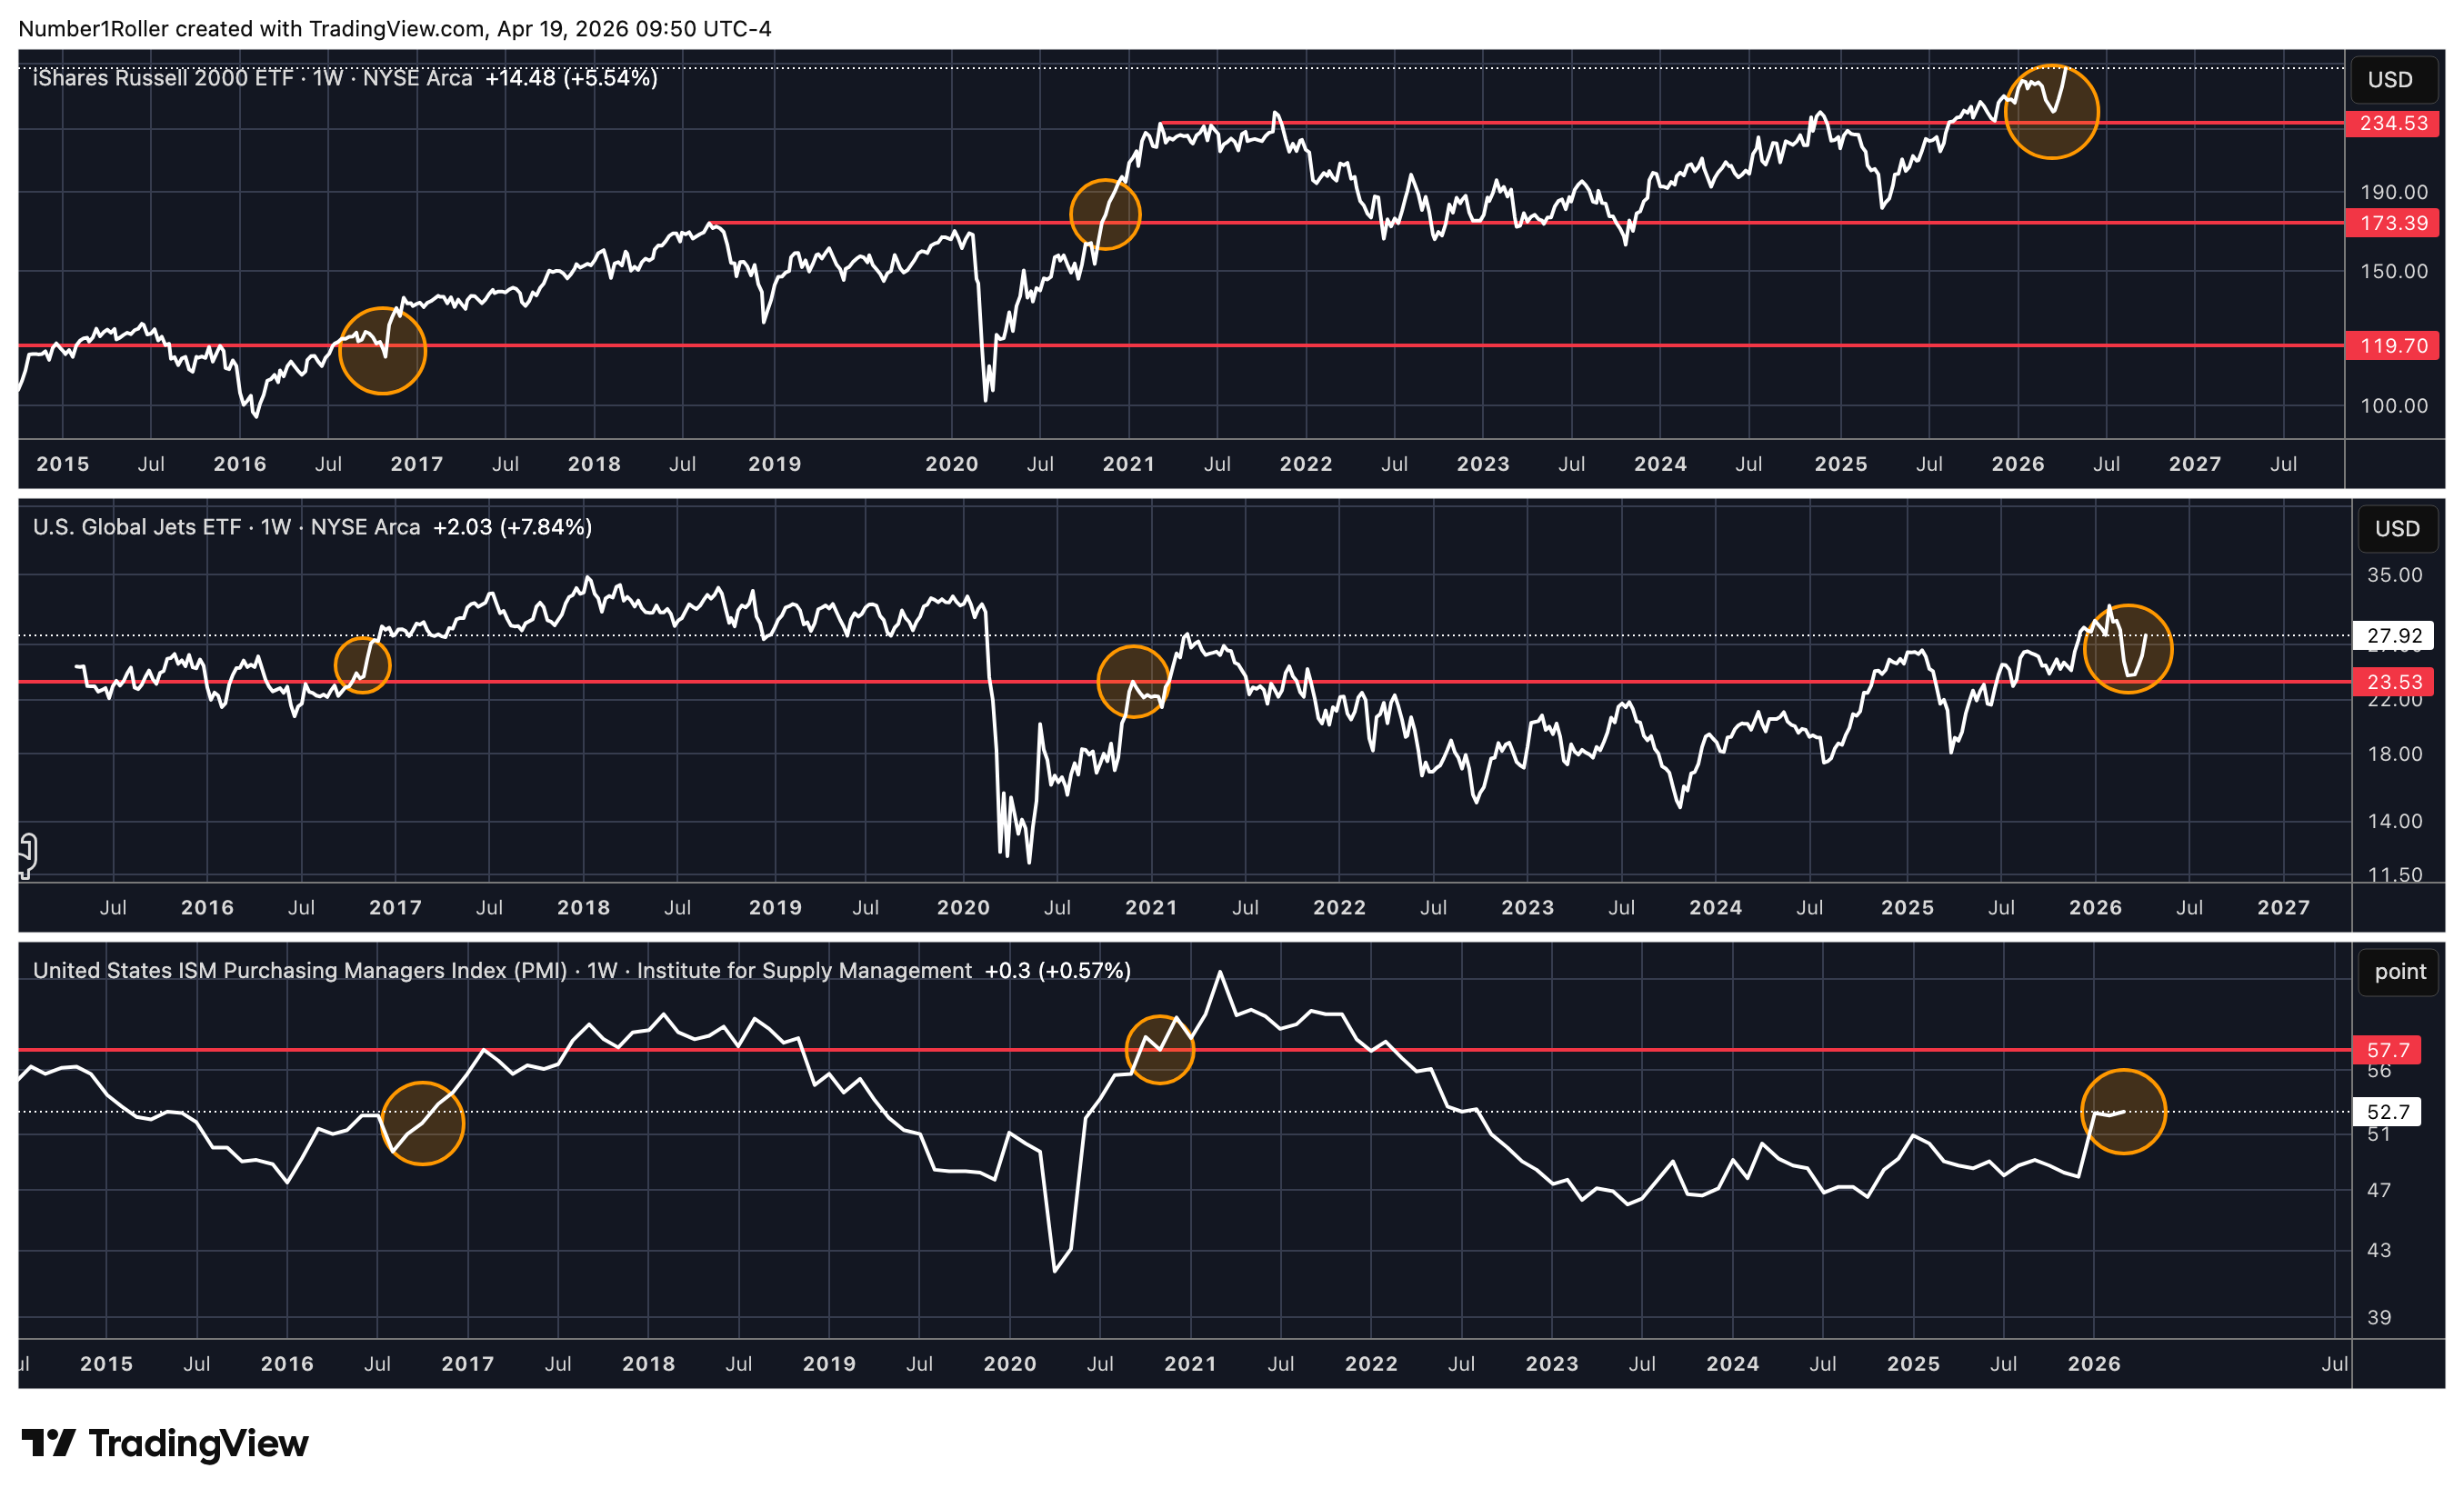
As you can see in the previous two bubbles when IWM broke out of a multiyear consolidation, and JETS begins a strong move above the 23.50 level, and ISM gets to the 57 level in an uptrend all conditions are satisfied that signal risk appetite is turning up, consumers are spending, and the business cycle is gaining momentum which historically has translated into a boom in alt coins.
Below is a closer look at ETH corresponding to the ISM in an uptrend and at the 57 level.
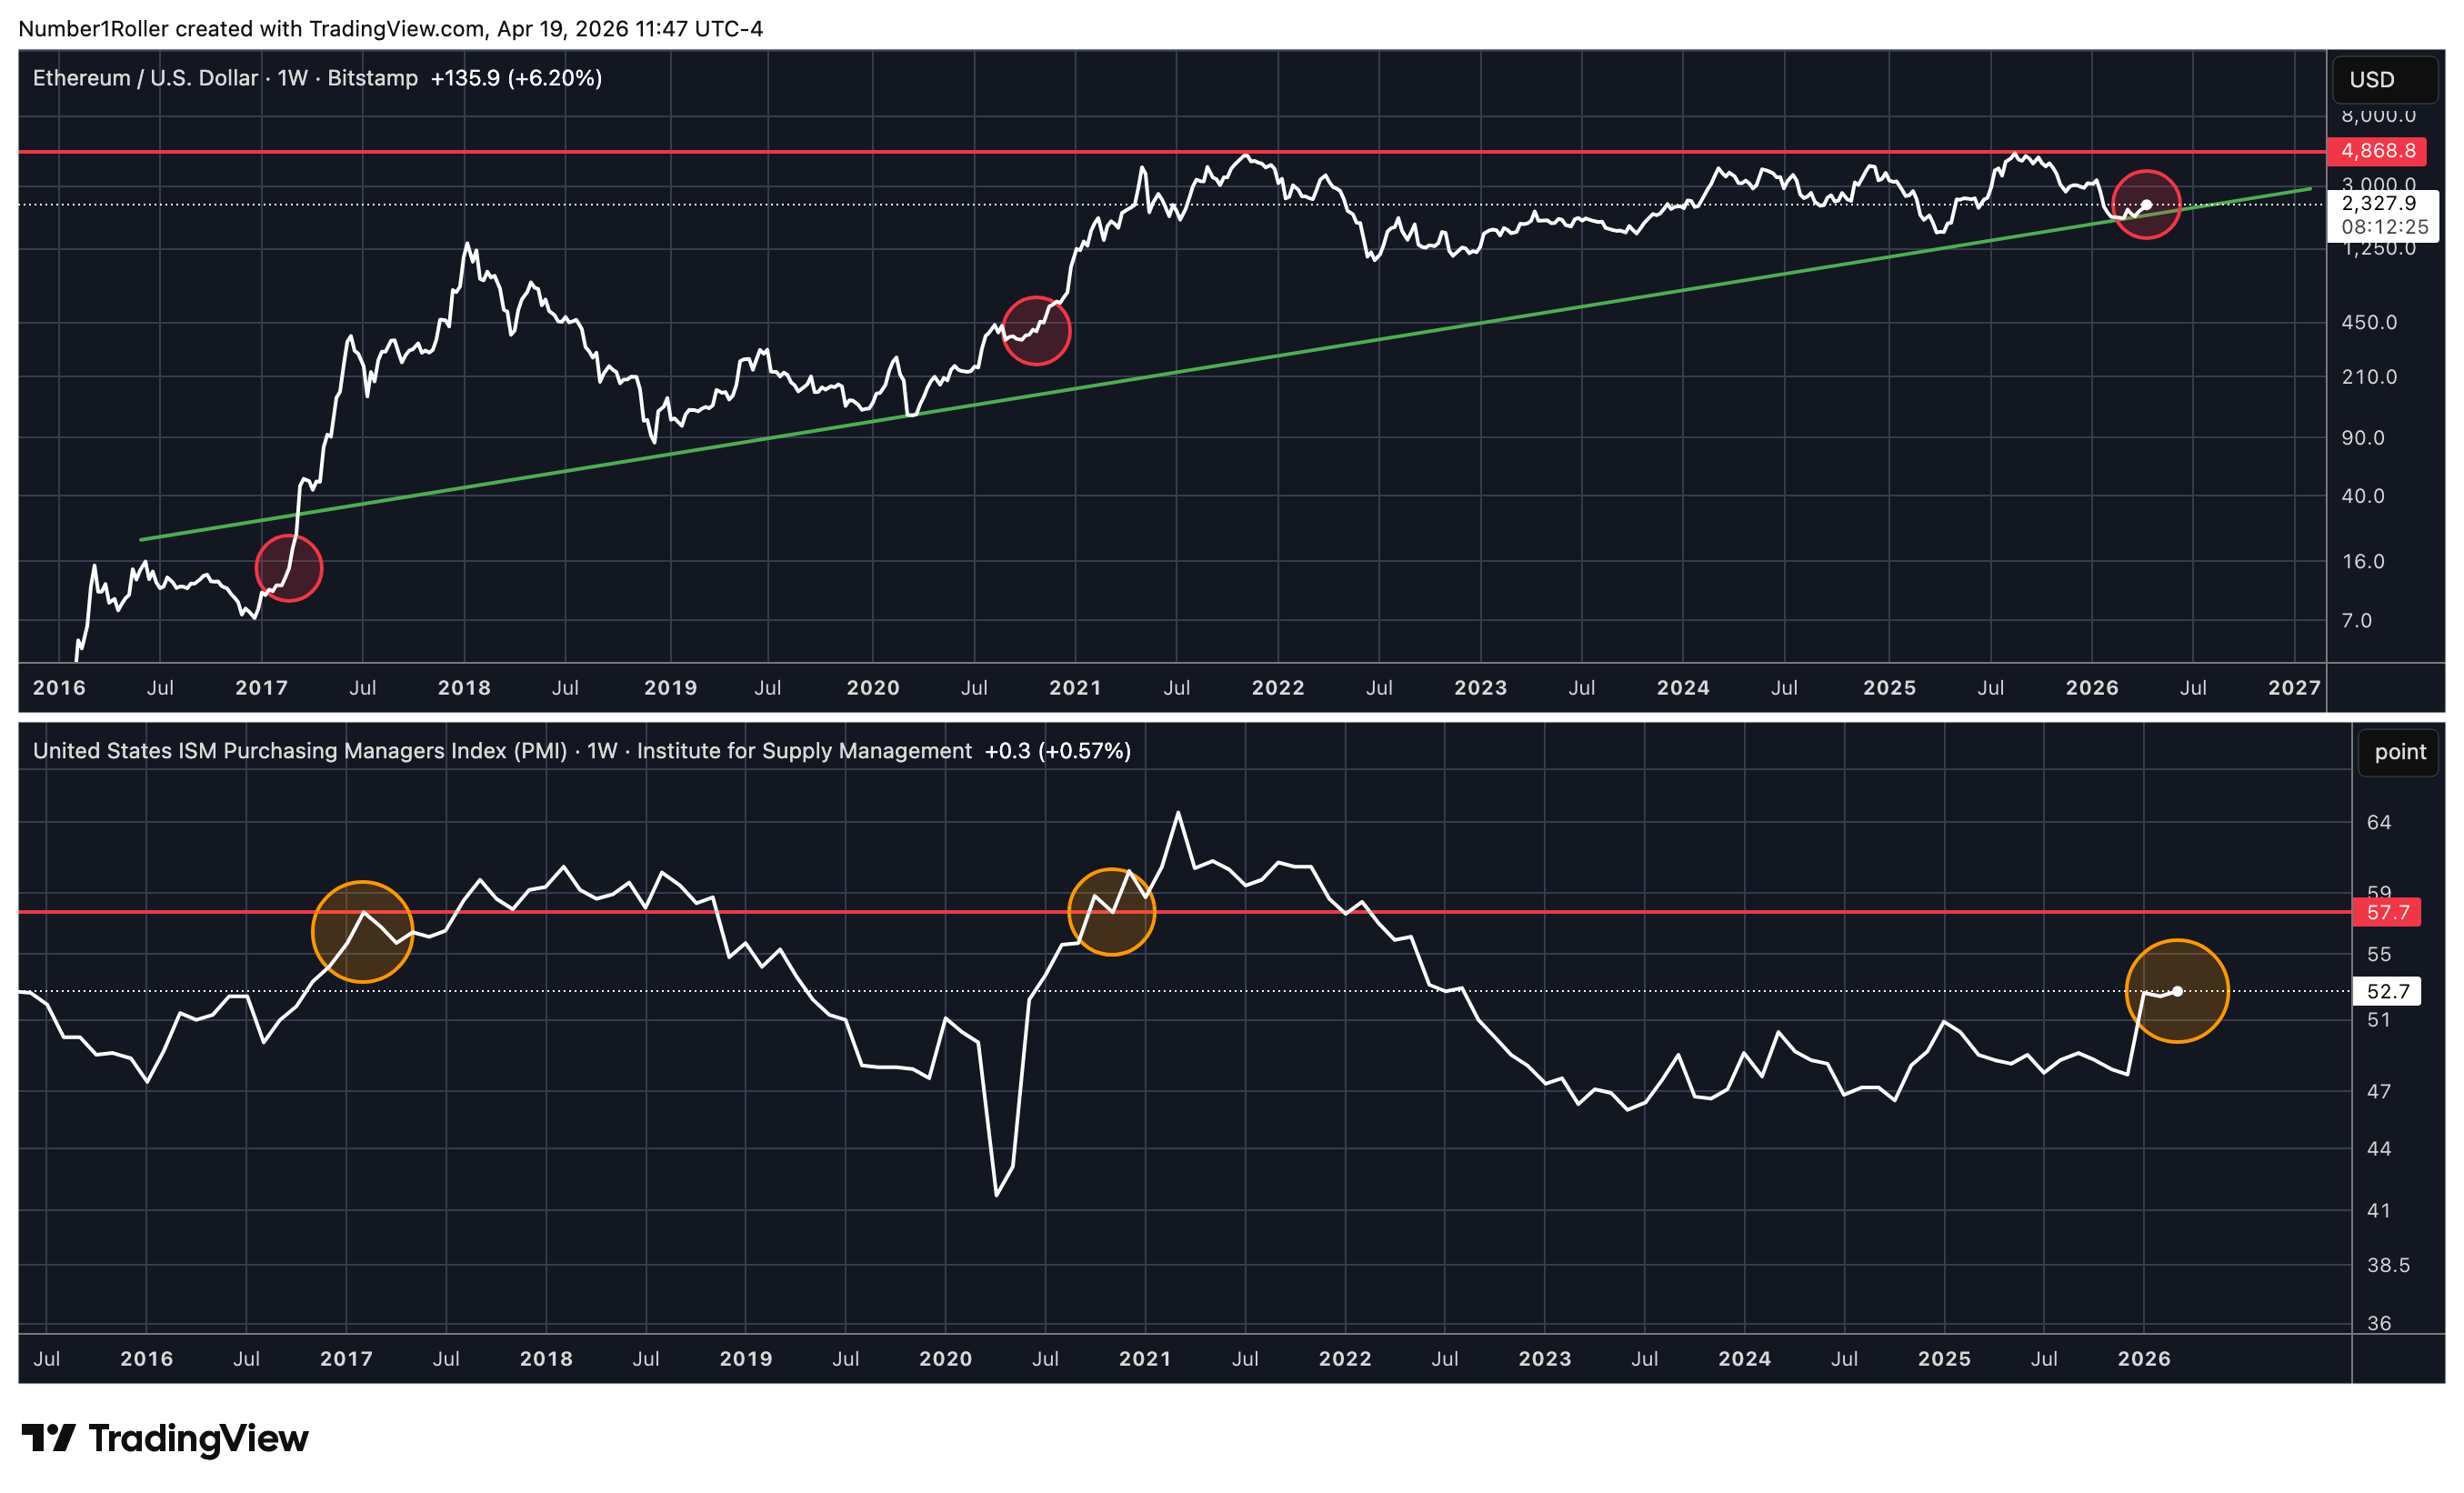
Same pattern. ETH bottoms, the business cycle starts ticking up, you get a divergence, and then once ISM breaks out to a certain level — ETH takes off like a rocket ship. Both 2016 and 2020 faired similarly on this measure.
So again, all the conditions are setting in place. the ISM is not quite to where we typically see big moves yet but it looks promising and has only gotten stronger in the last 3 months.
ETH vs. Small Caps
In the below chart we have the RUT small cap index relative to SPY over ETH price. There have been three major breakouts in the RUT against spy in the last decade. Each one of those breakouts is shown in the orange bubble and corresponds to the same orange bubble on the ETH chart.
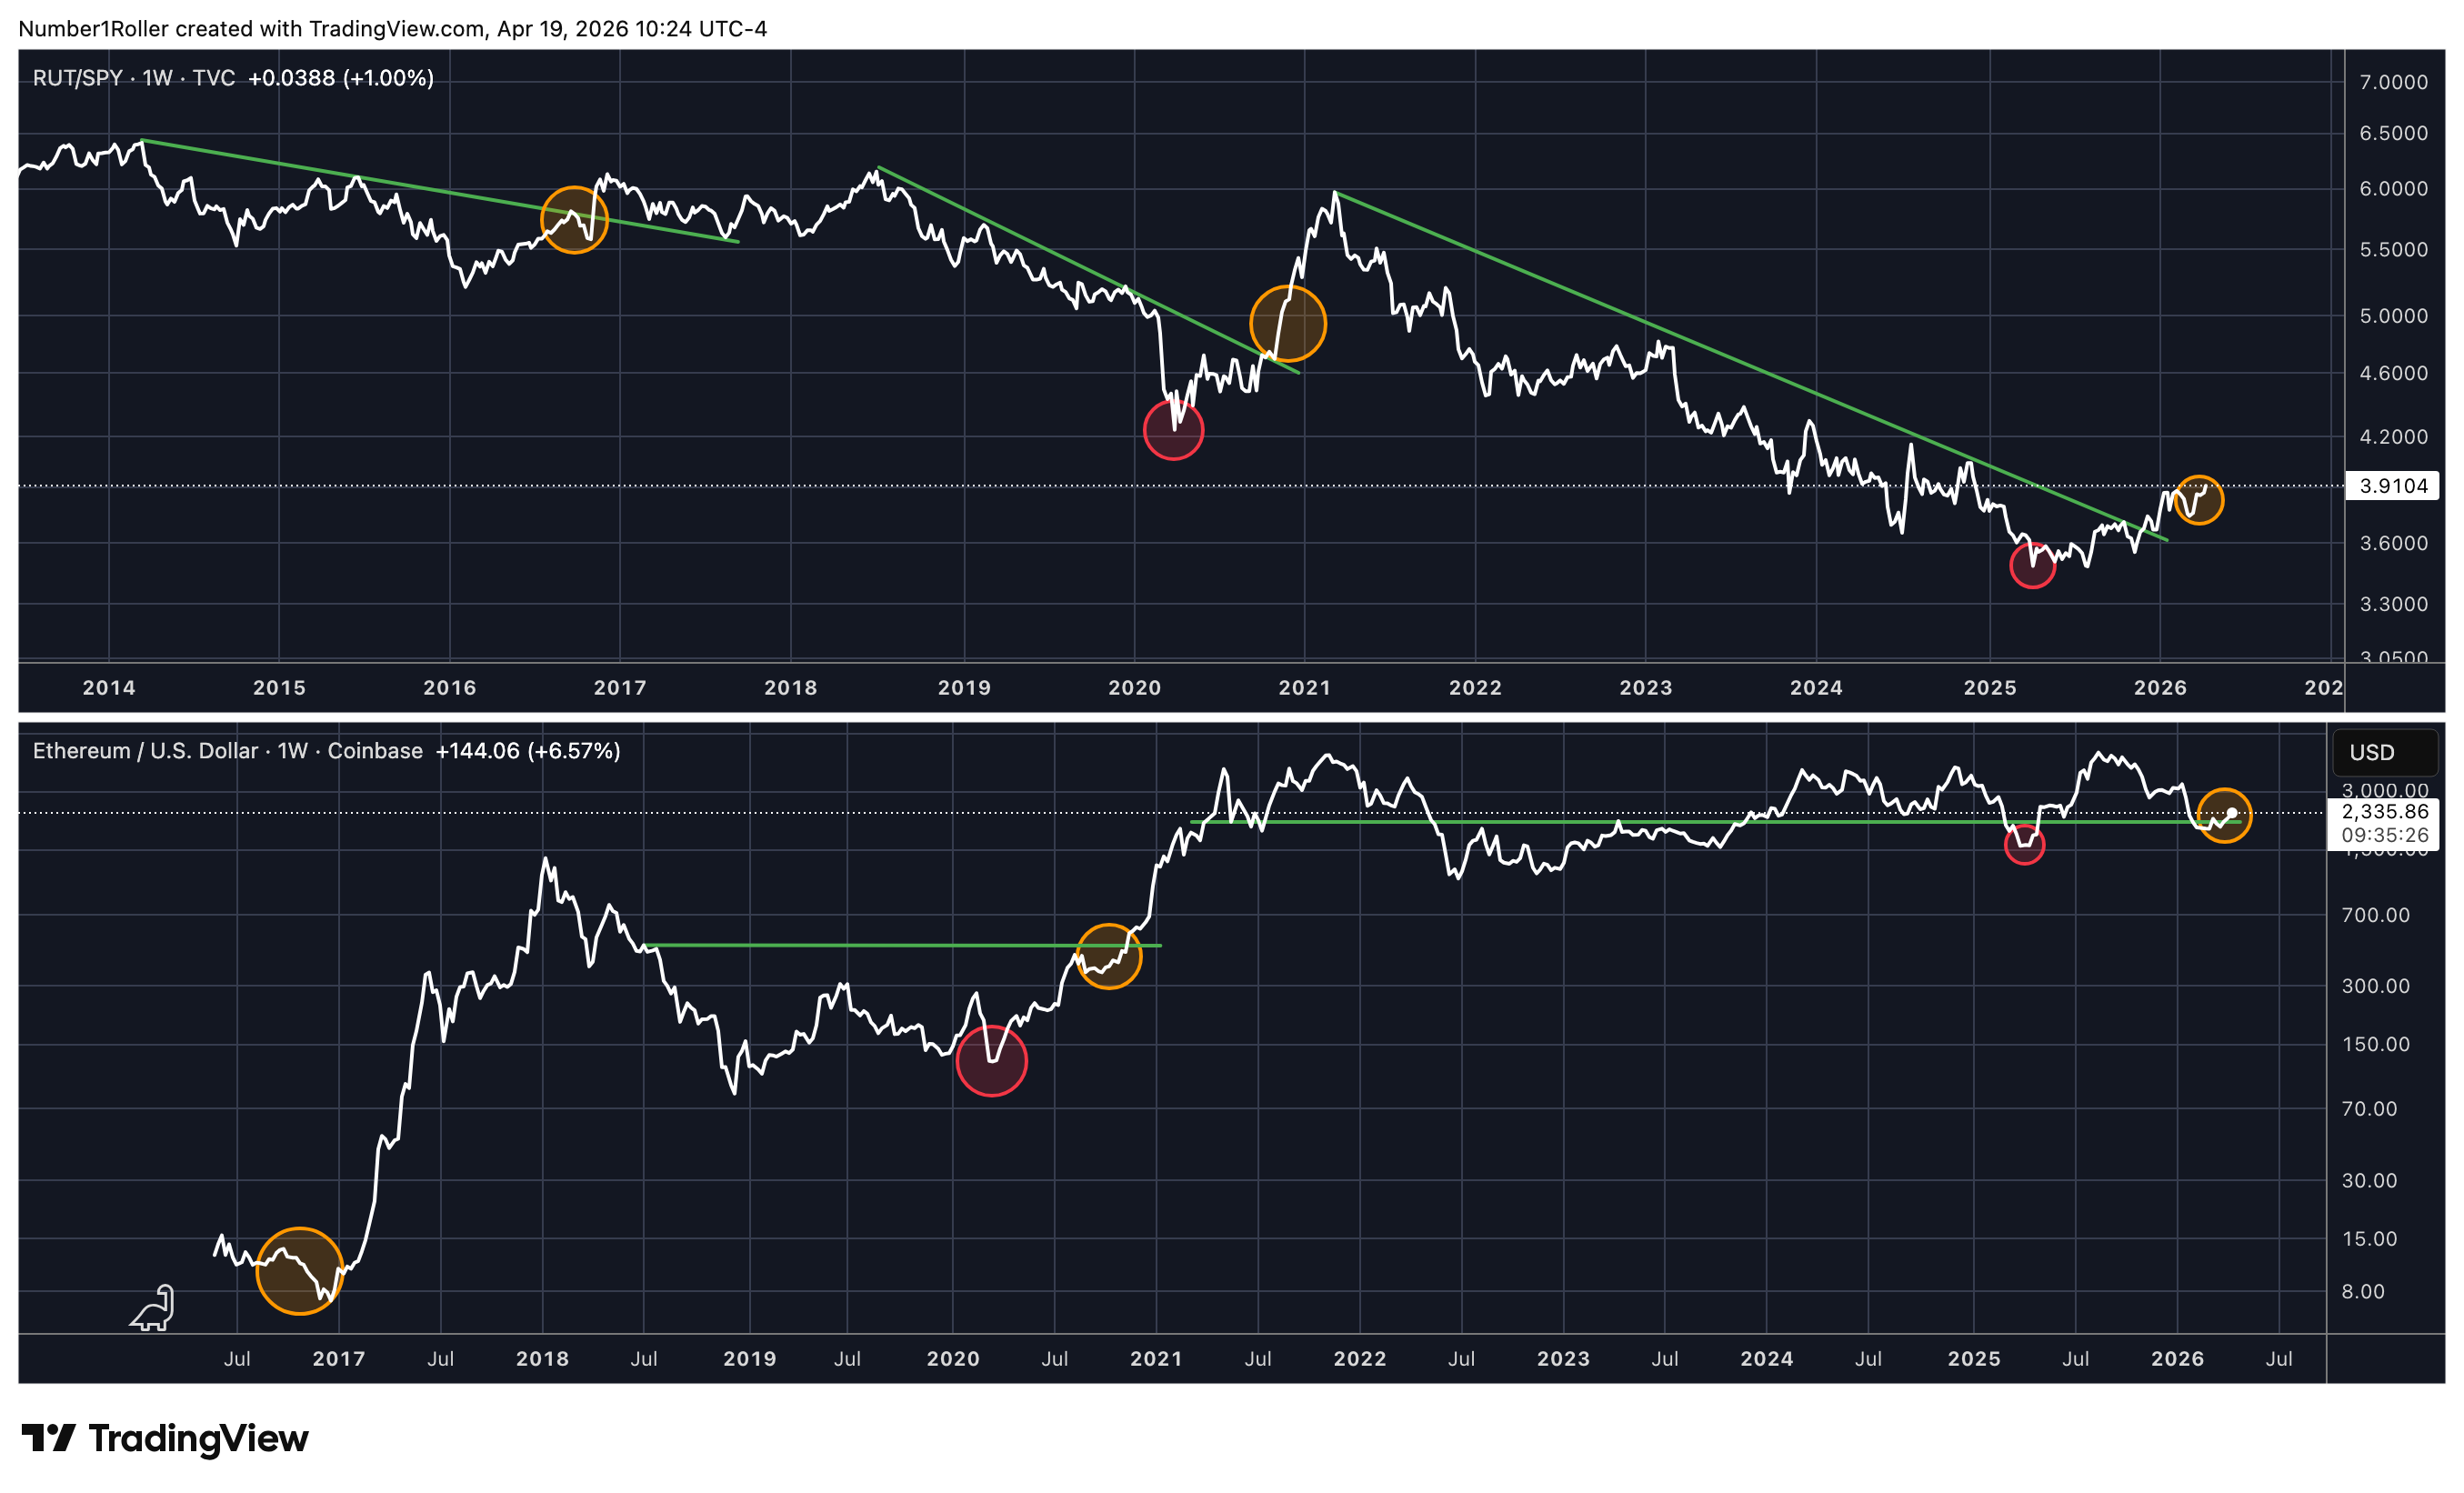
This current breakout is by far the biggest after coming off of a five year downtrend very similar to how alt coins have behaved in the last five years against BTC. Whats interesting is that the green lines on the ETH chart correspond to the same time of the green lines on the RUT/SPY chart. Both show how ETH traded flat from peak to breakout on RUT/SPY.
Back in January we pointed out that Ethereum was “the biggest liar in the market” — everything else was going up while ETH went down. The only other time we saw that divergence was during the 2016 move, which resolved with a massive reversion to the mean.
Why This Isn’t 2023
Here’s the key distinction most people are missing.
Yes, there are similarities to the 2023 bottom. We’ve already outlined the time factors and structural alignment. But in 2023, we did not have macro risk indicators breaking out. We did not have Bitcoin dominance in a late-stage rotation. That move happened without full confirmation.
This time is different.
Now you have structure, timing, and macro conditions all aligning at once. That’s the difference between a reflexive bounce and a true cycle low.
And when all three line up, the upside is not comparable.
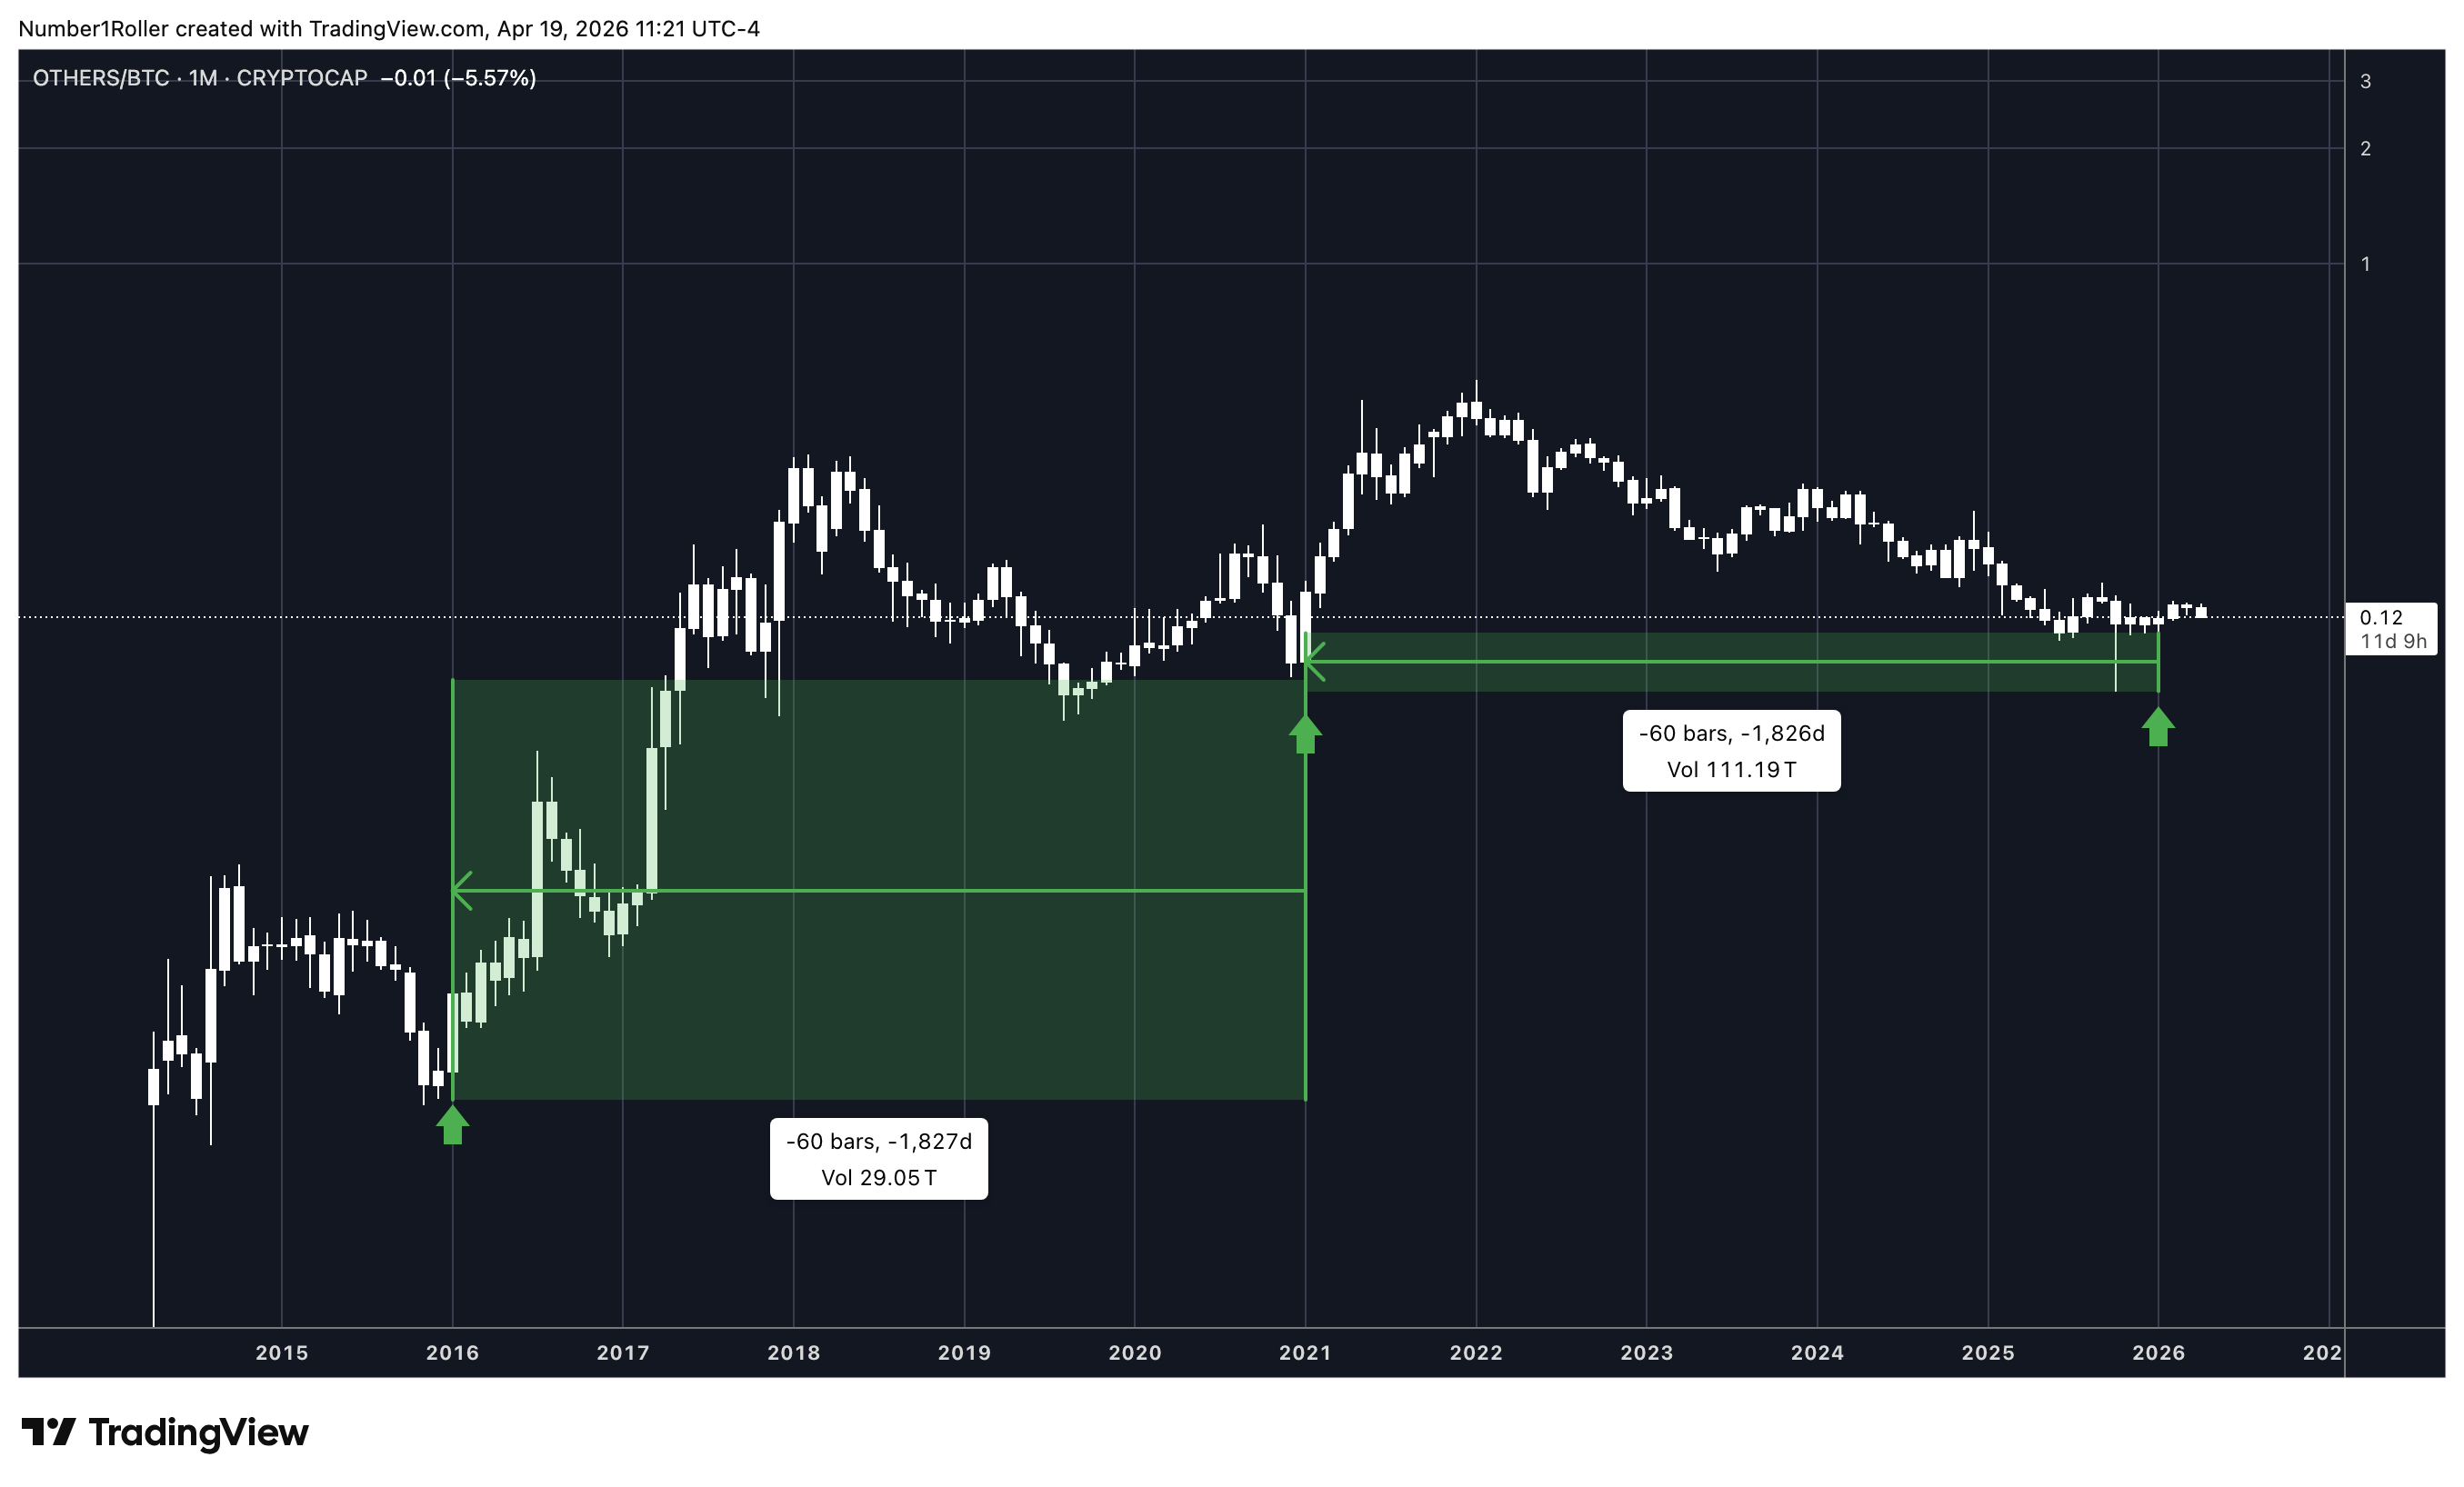
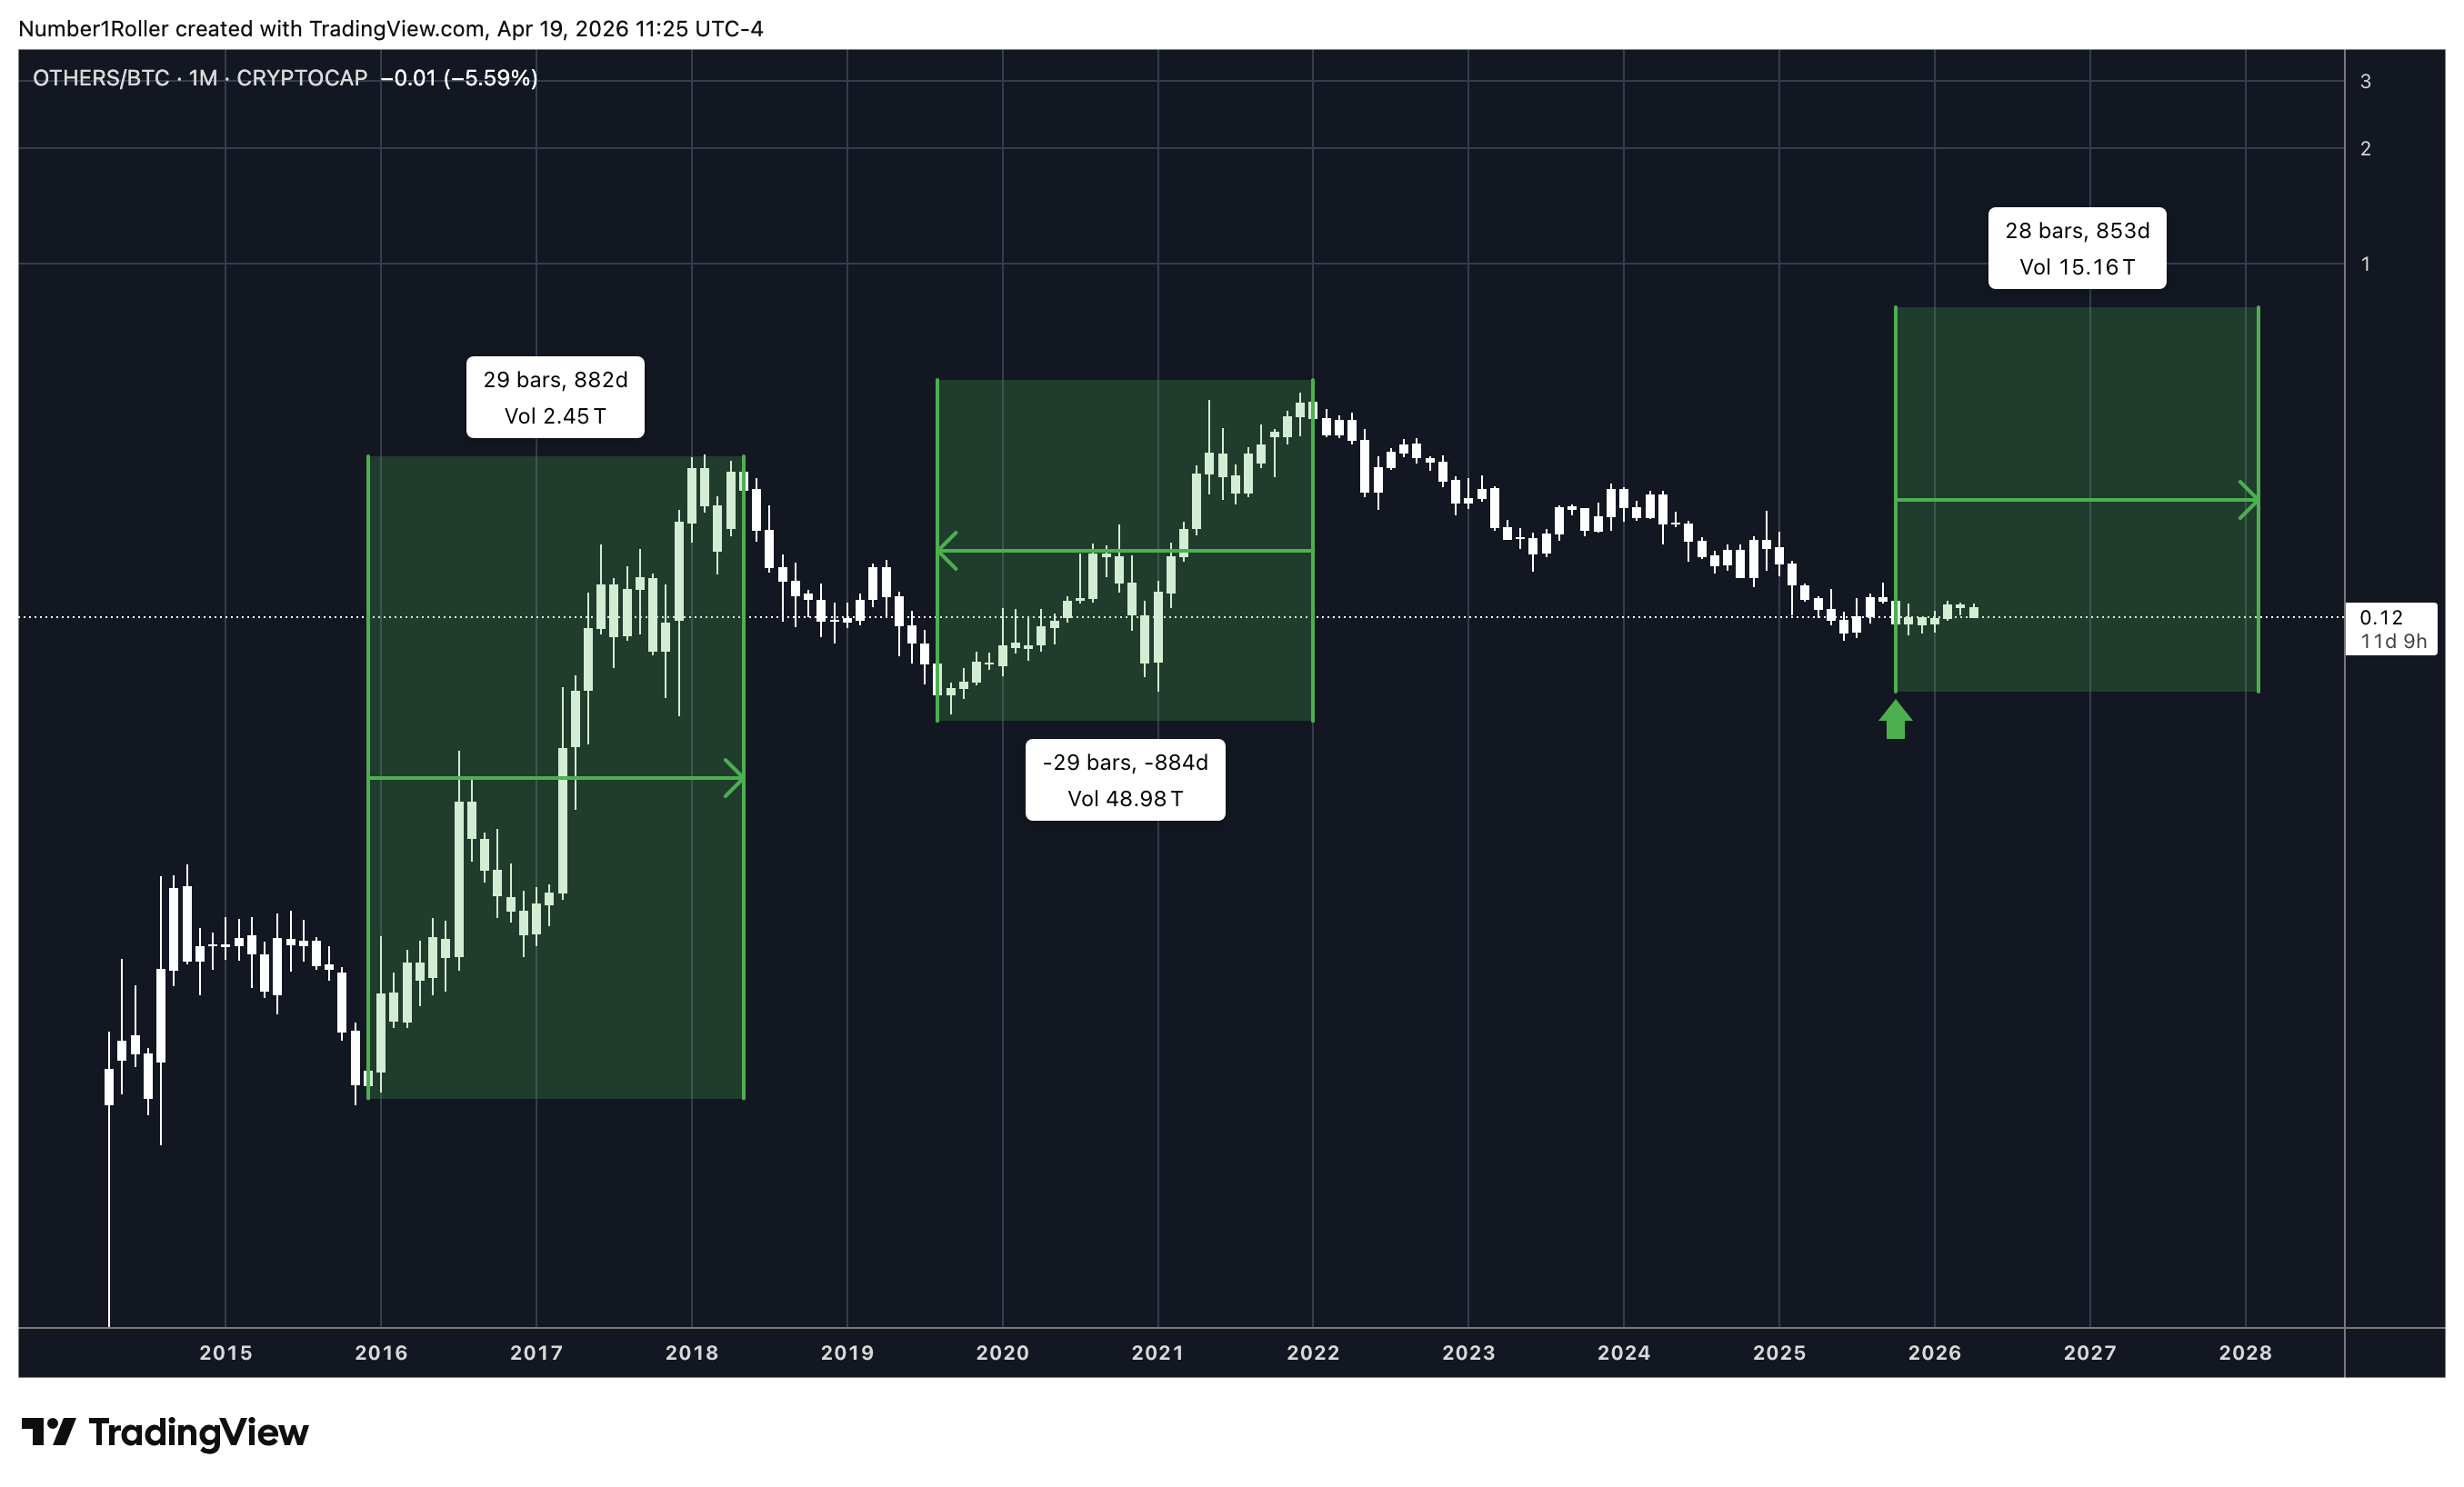
The “Others” Chart: The 60-Week Cycle
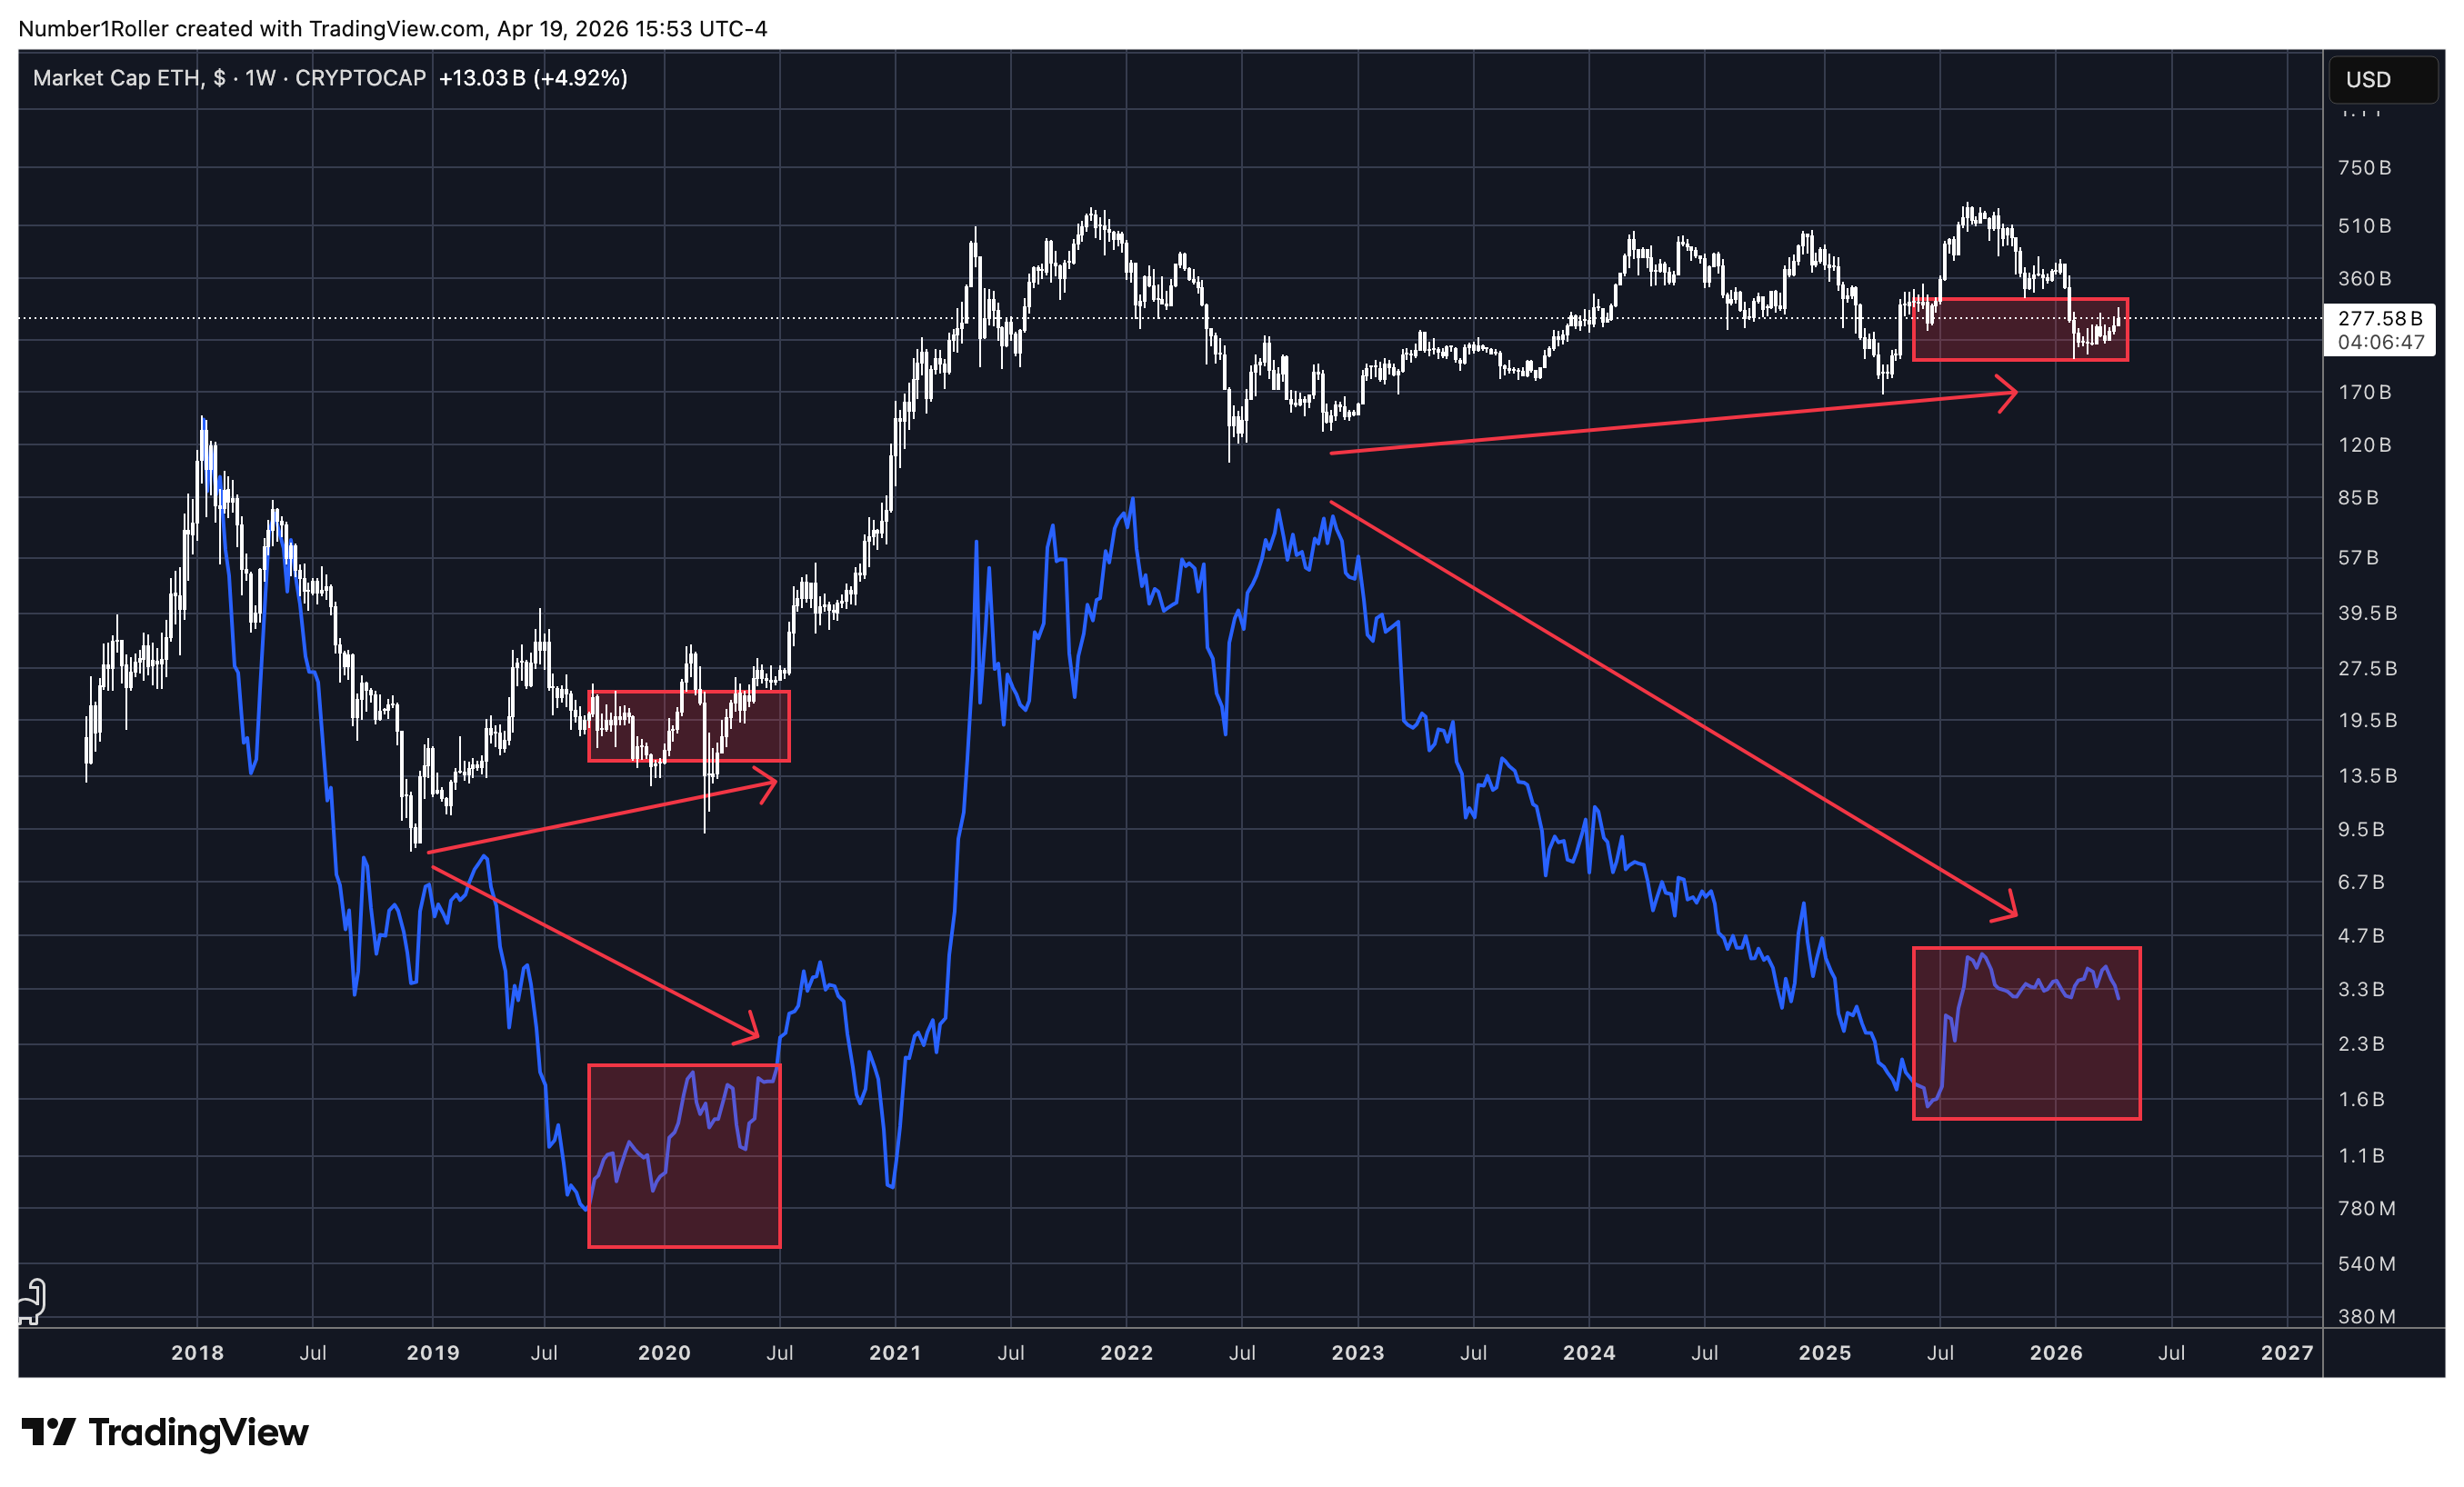
Here’s where it gets really clean. “Others” — total crypto market cap excluding the top 10 — is essentially altcoin small caps.
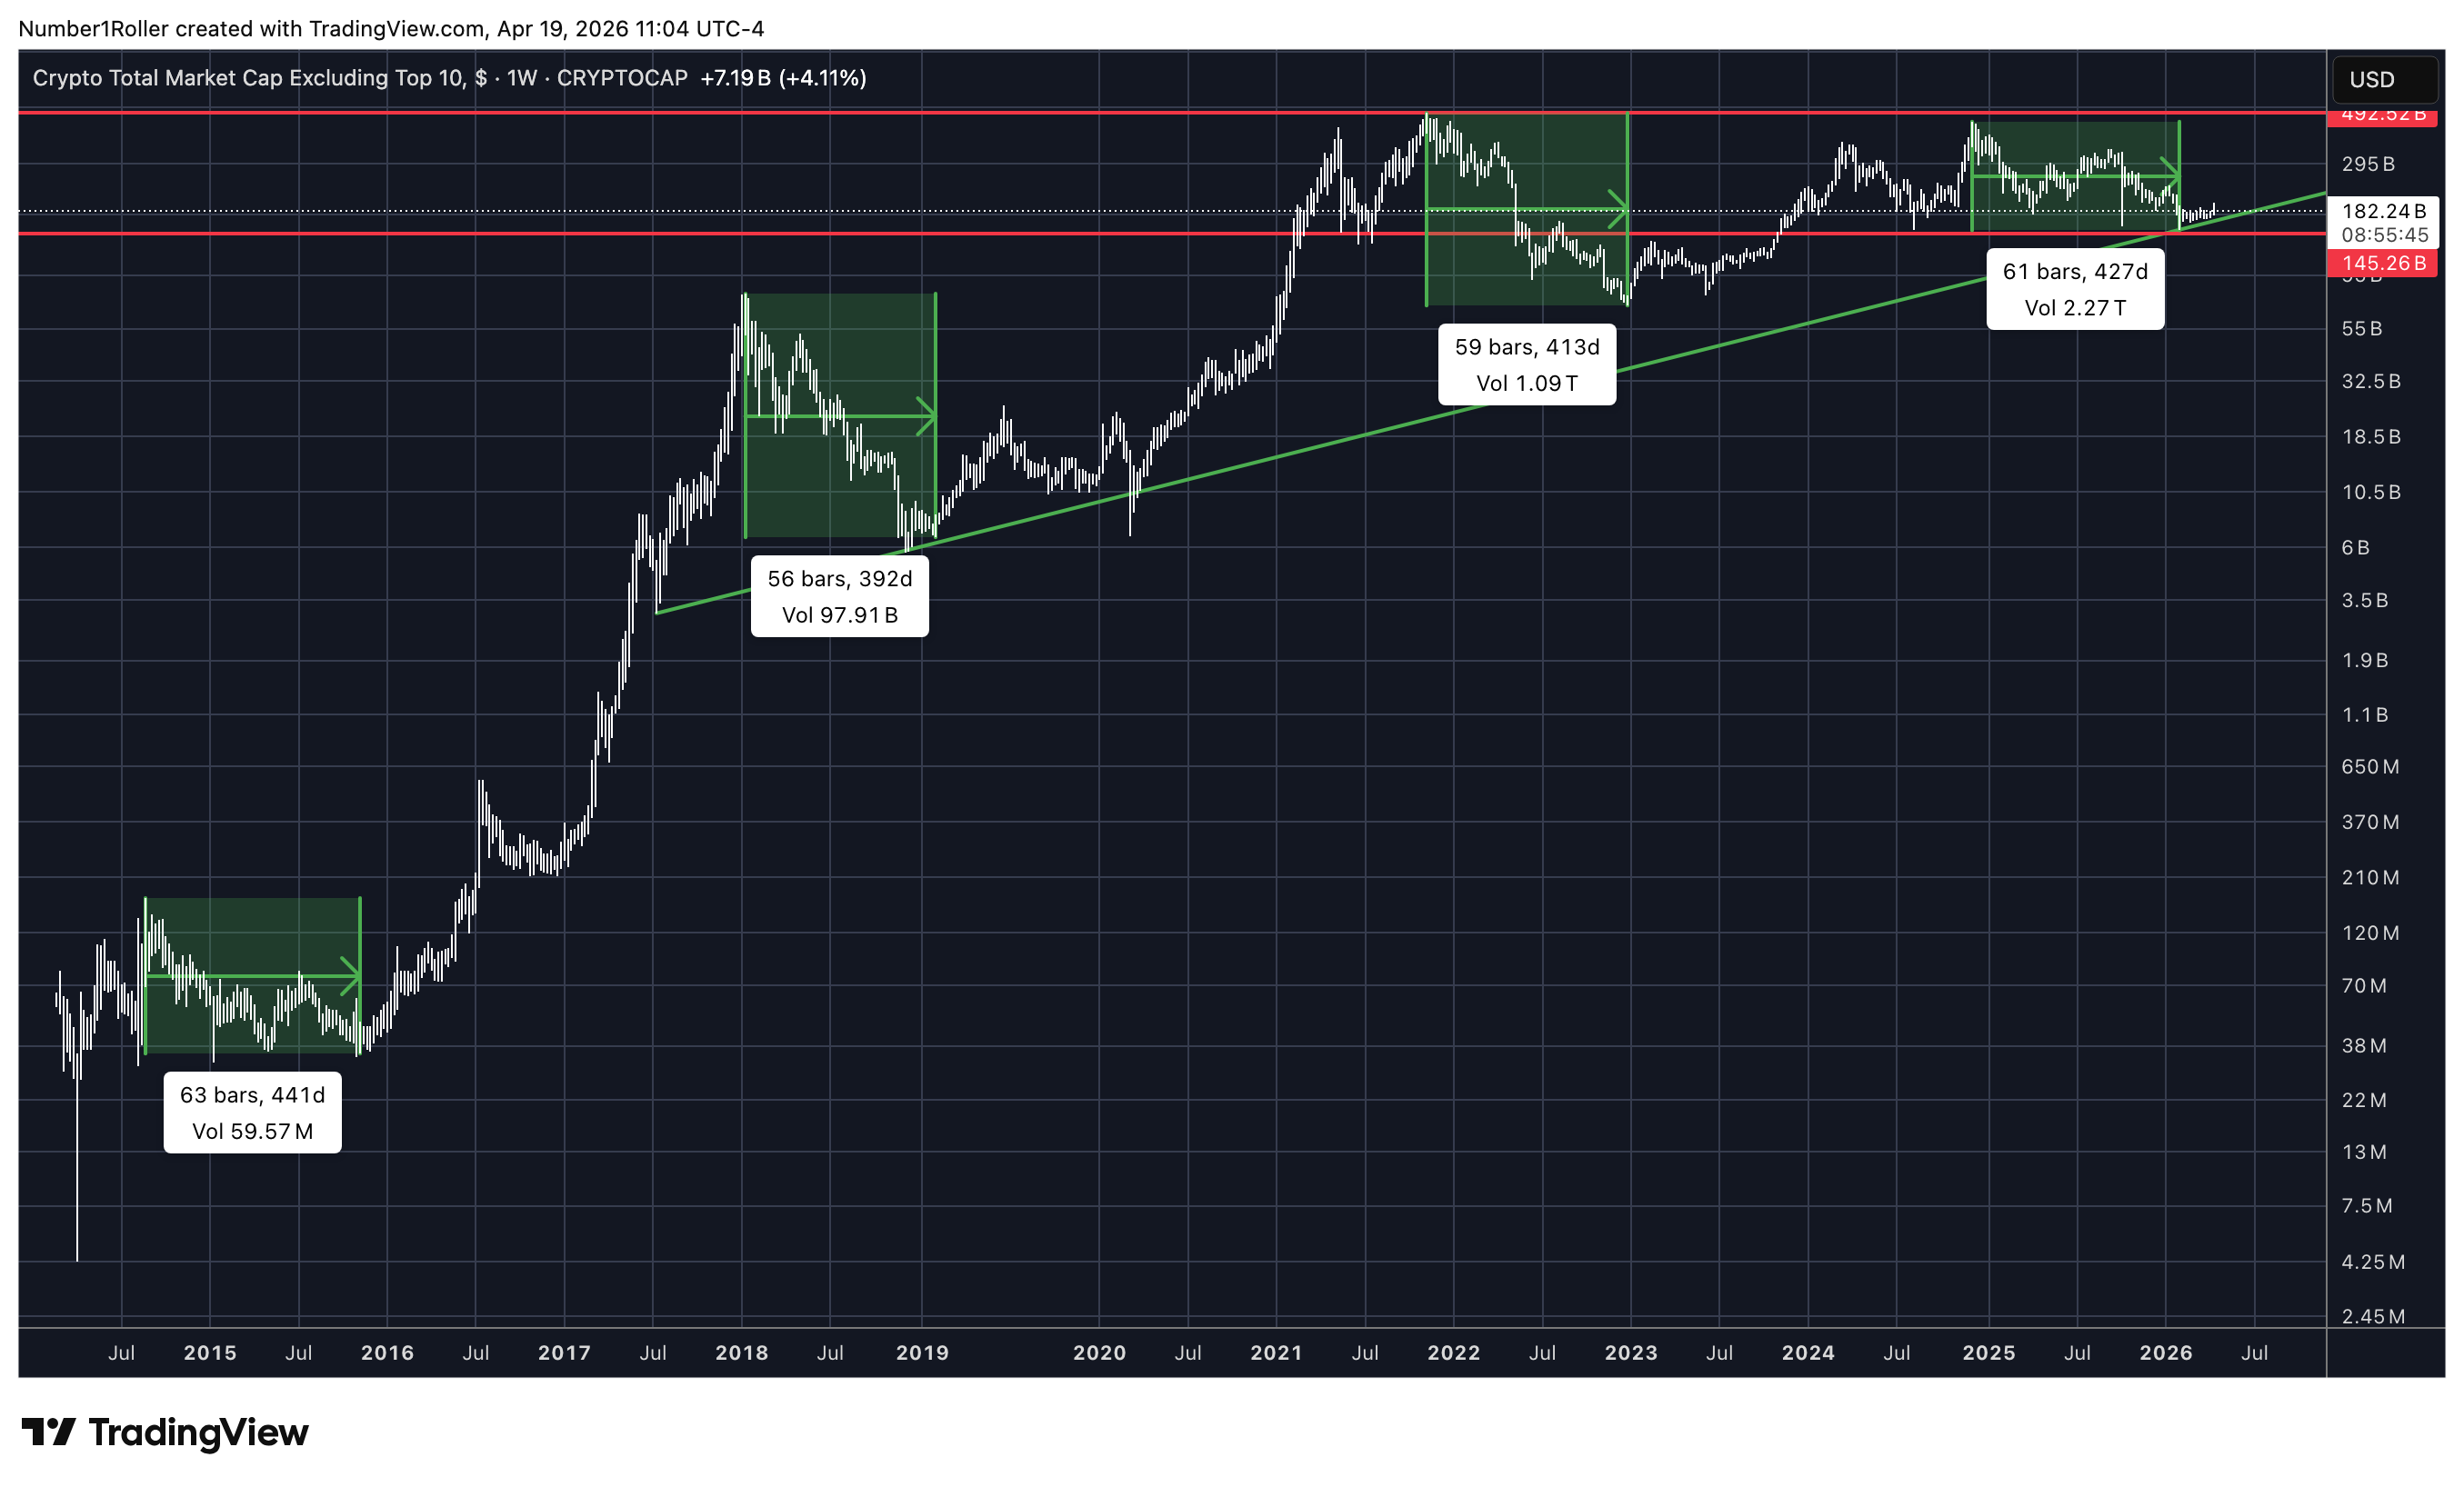
There is an almost perfectly consistent 60-week cycle in this market. It doesn’t matter how you slice it:
Major top to major bottom: 60 weeks
Major bottom to major top: 60 weeks
Regime change: every 60 weeks
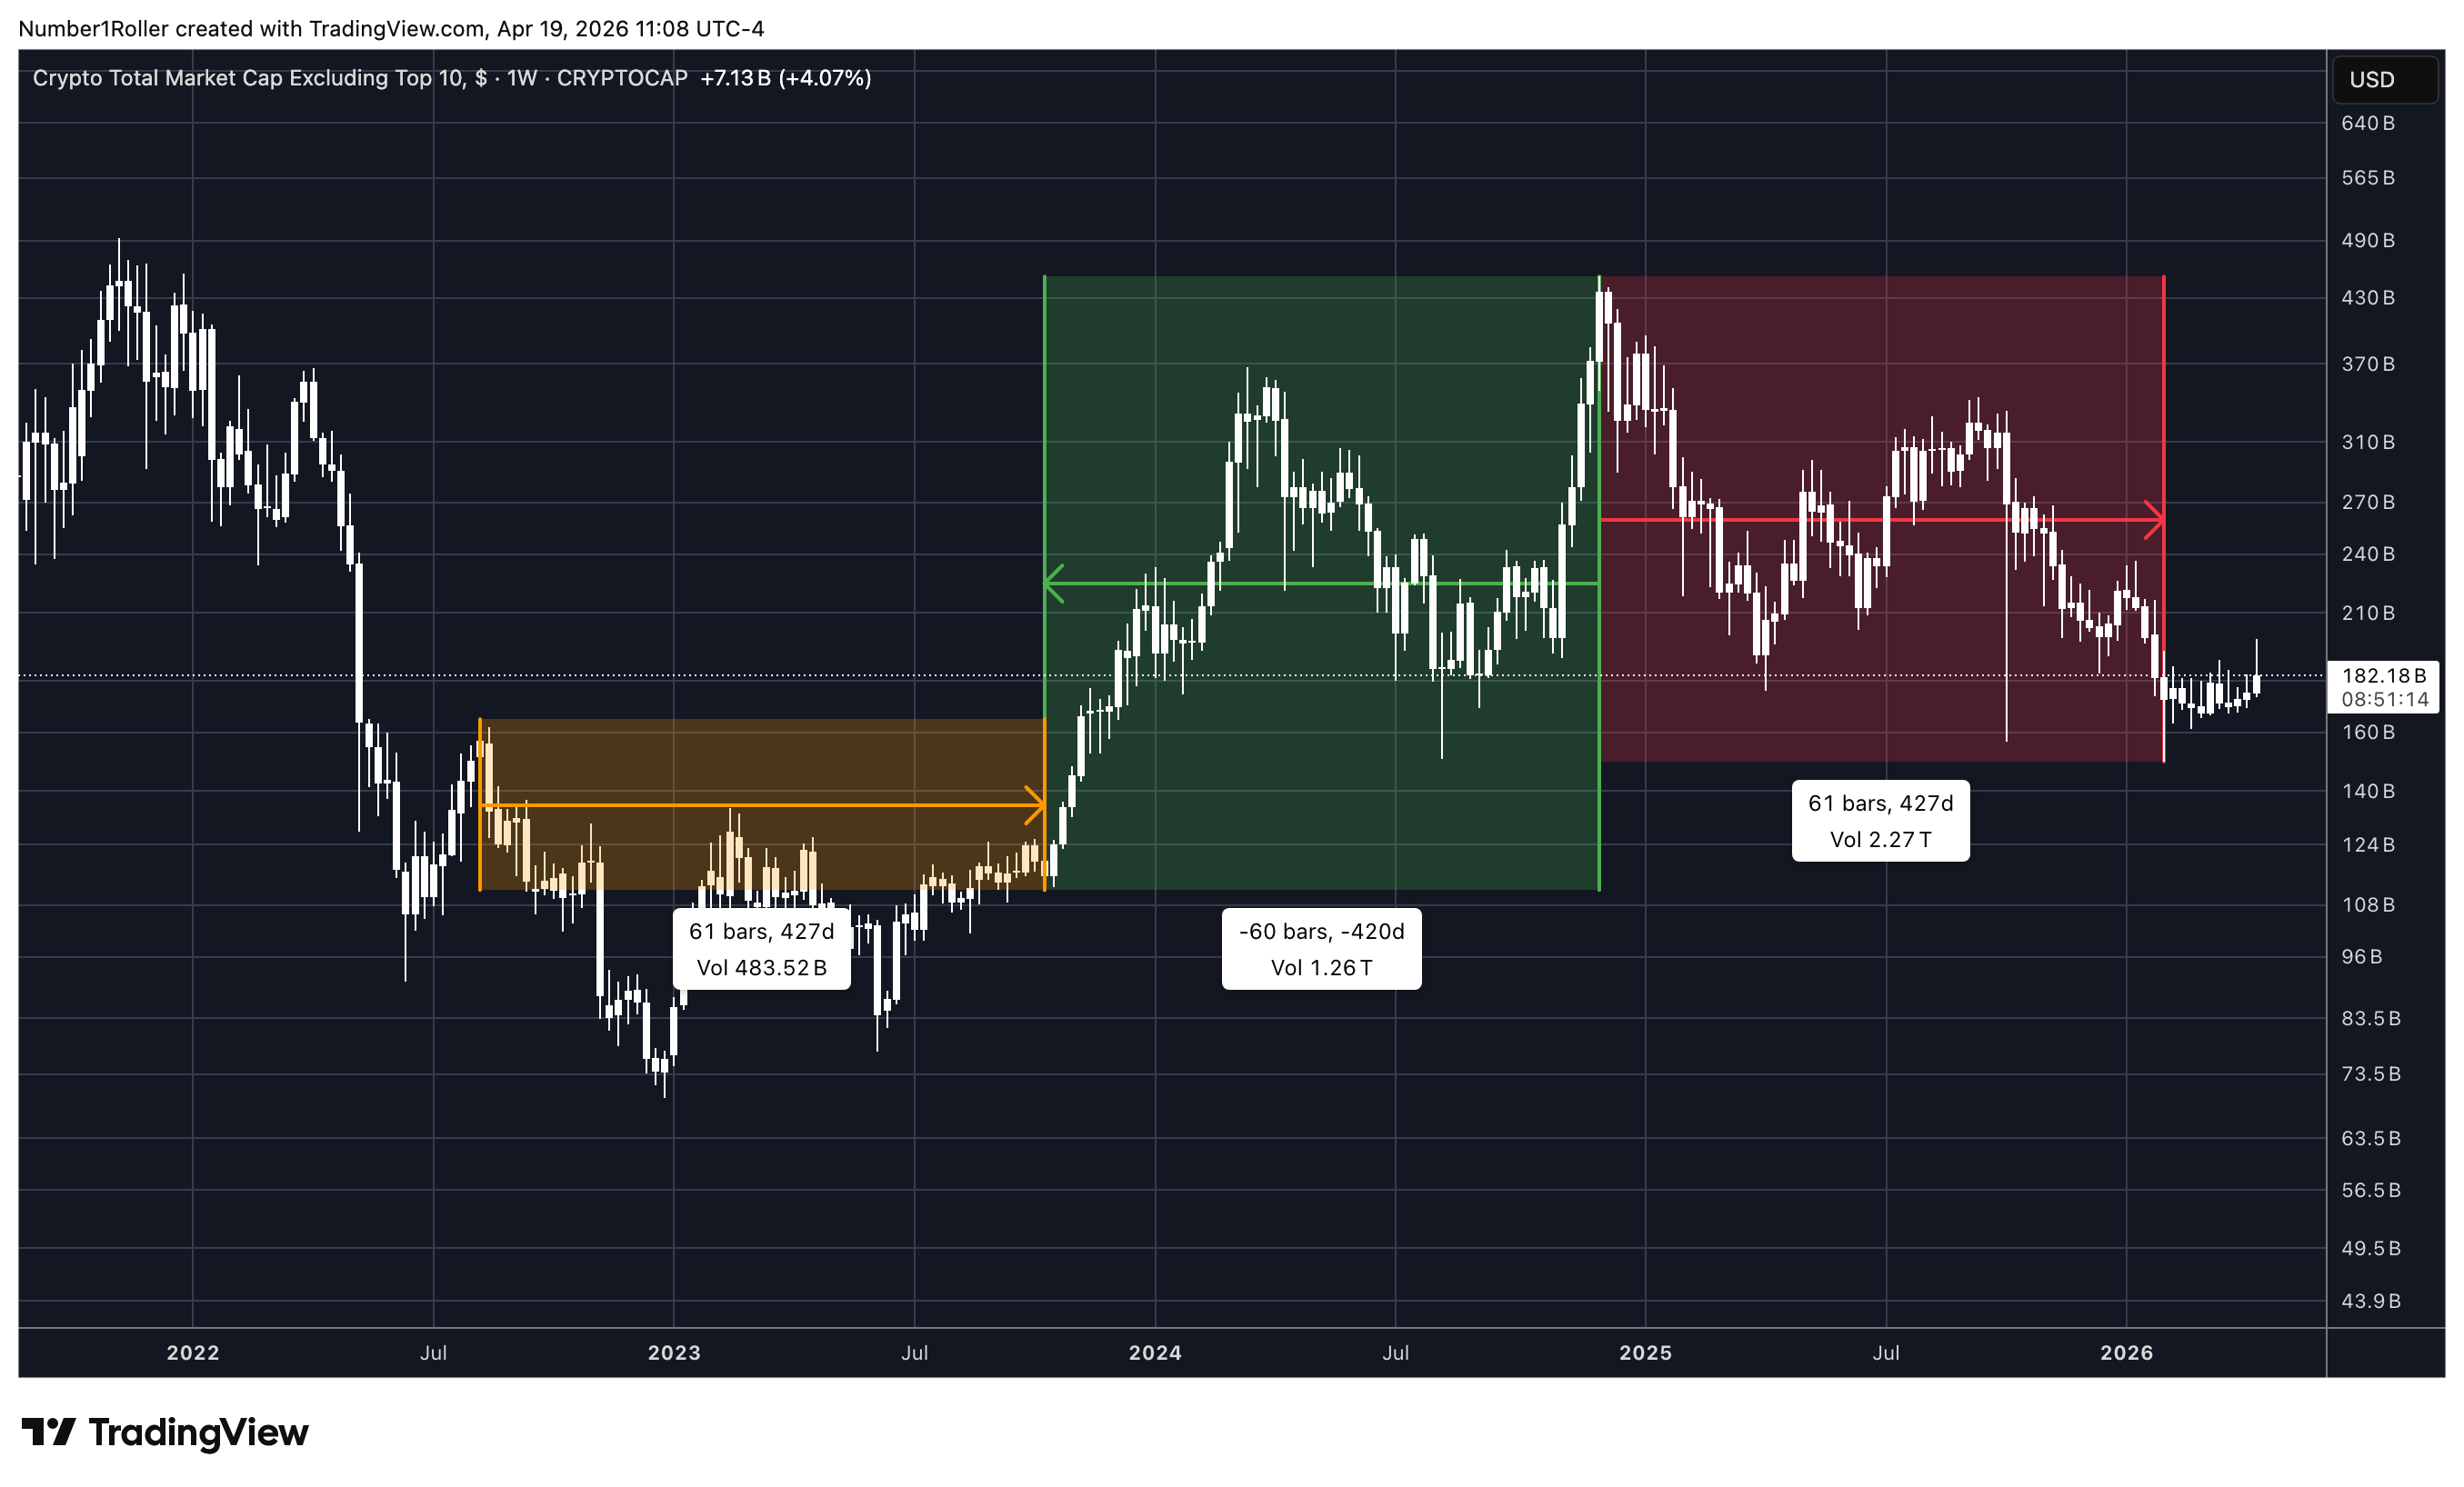
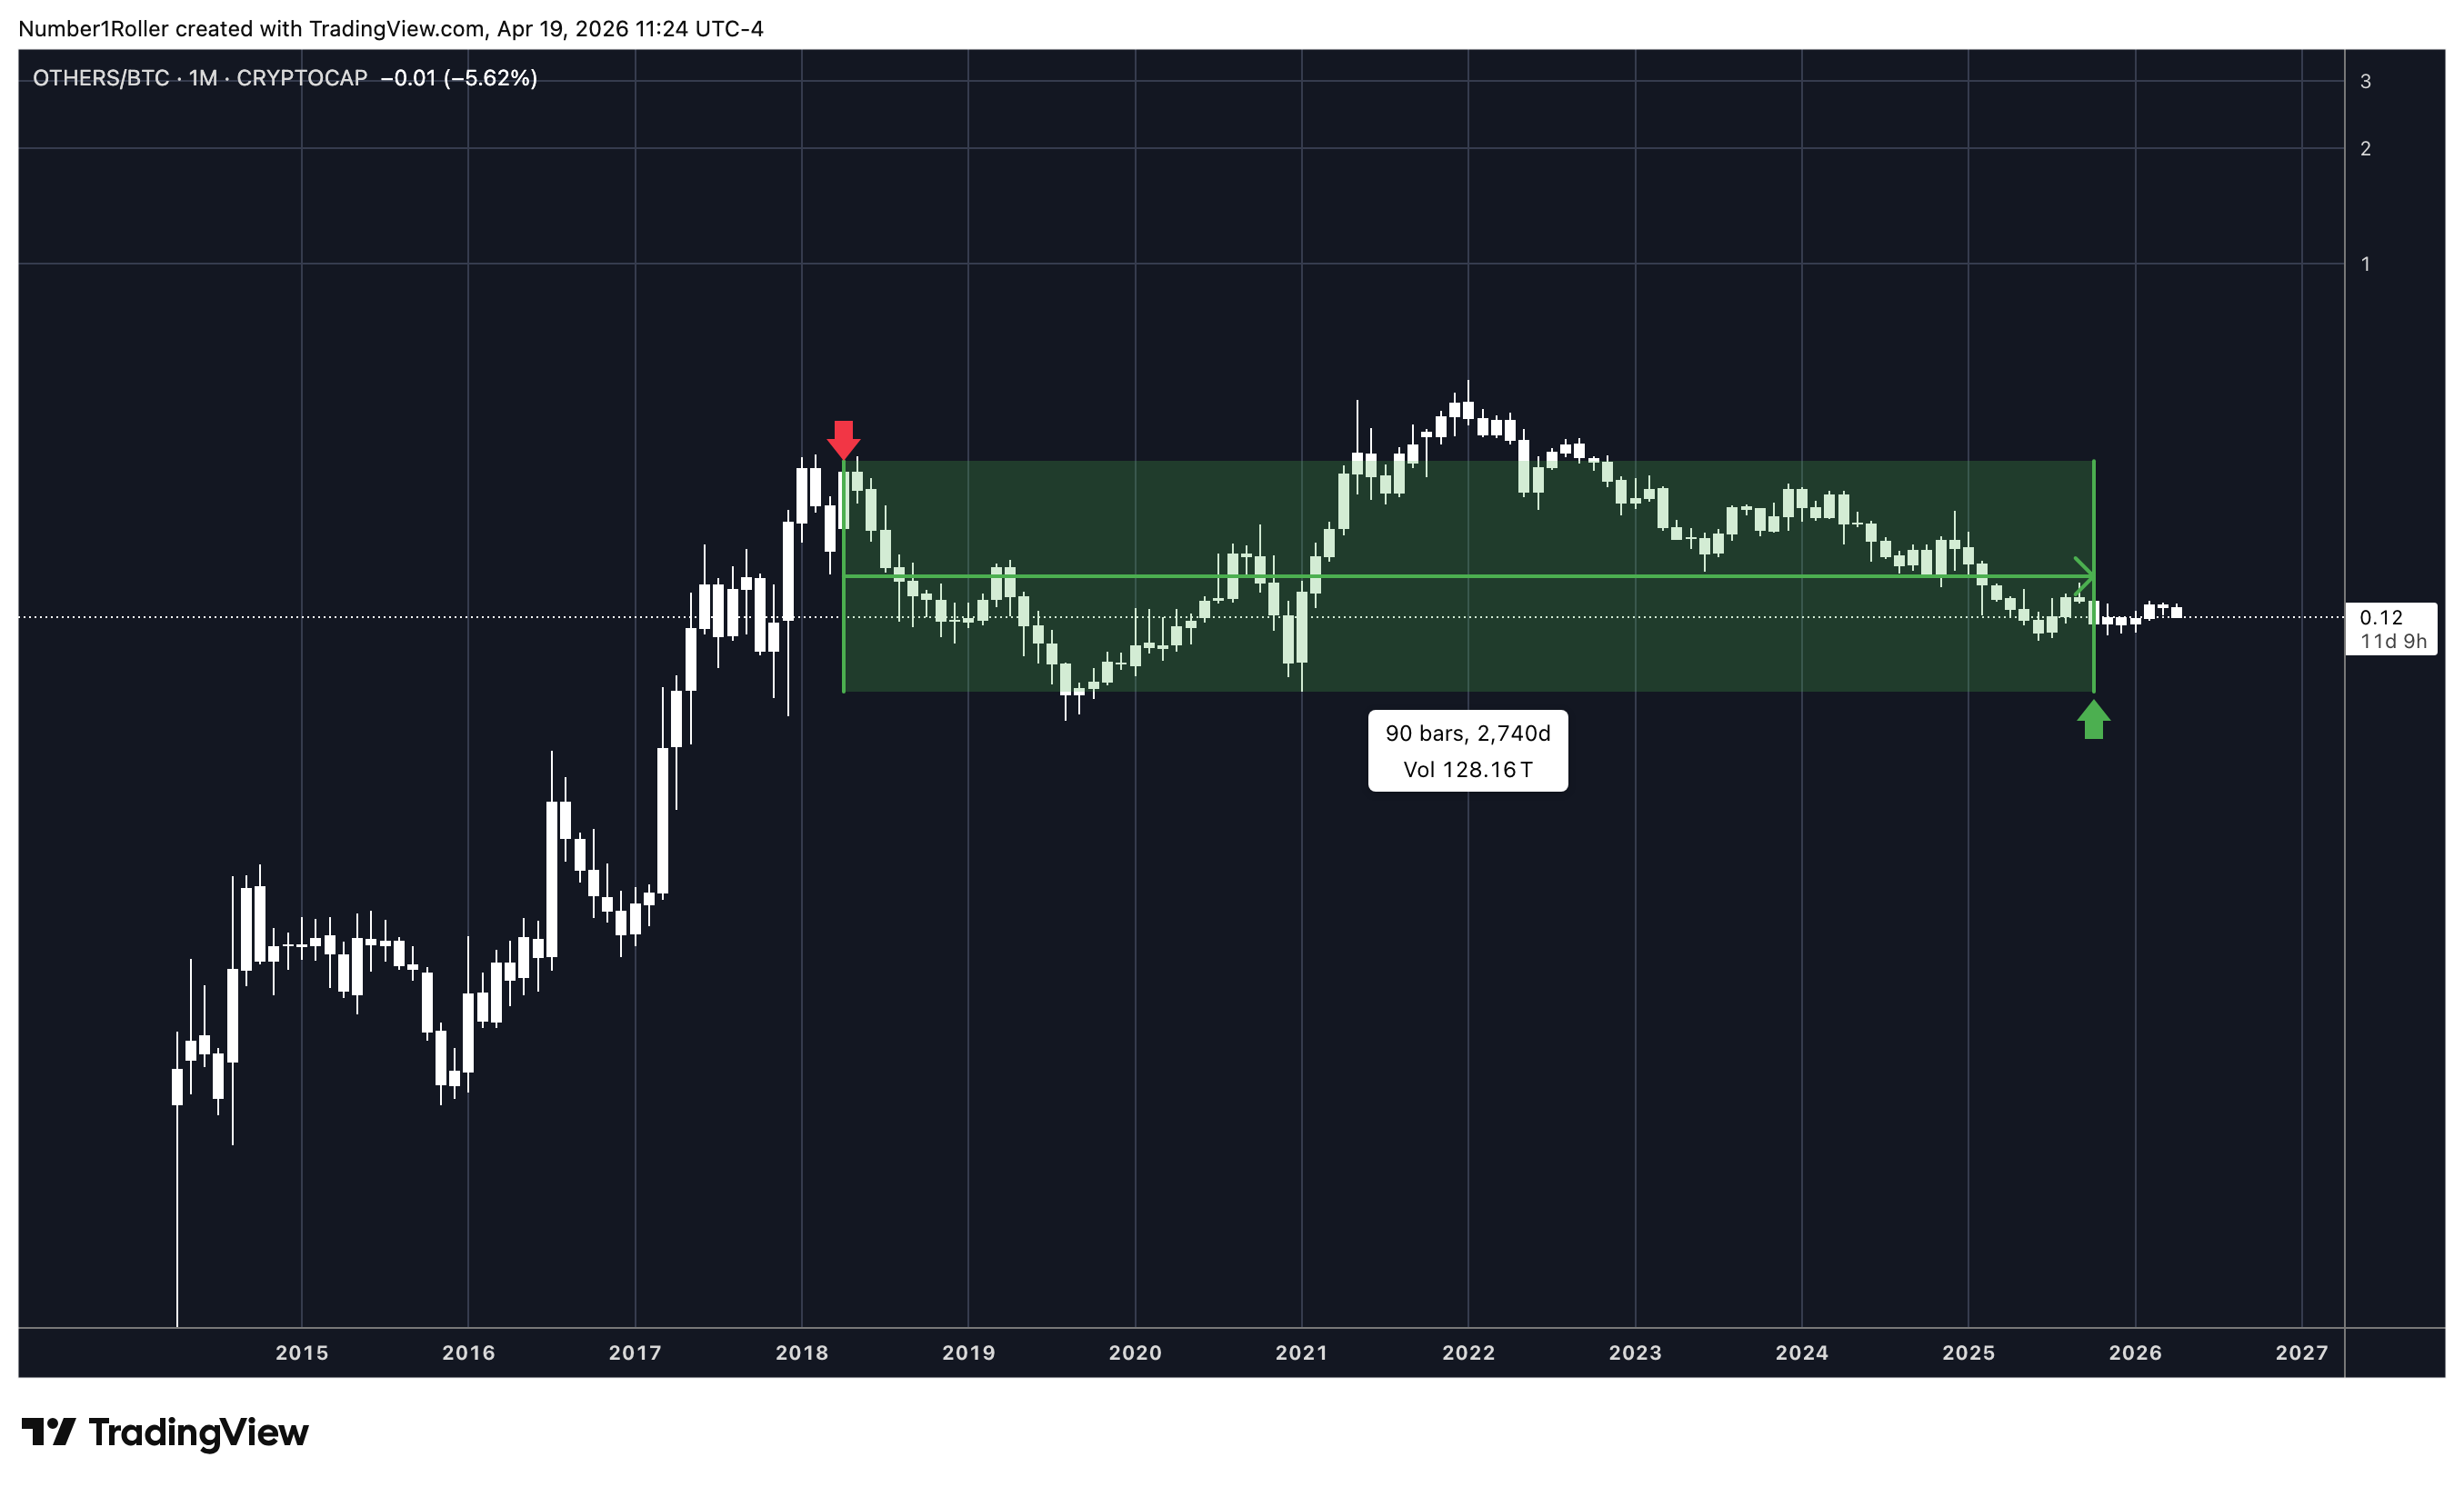
You can measure nearly any significant point on this chart and the the regime flips just about every 60 weeks. We just completed a 60-week drawdown from the top to the bottom.
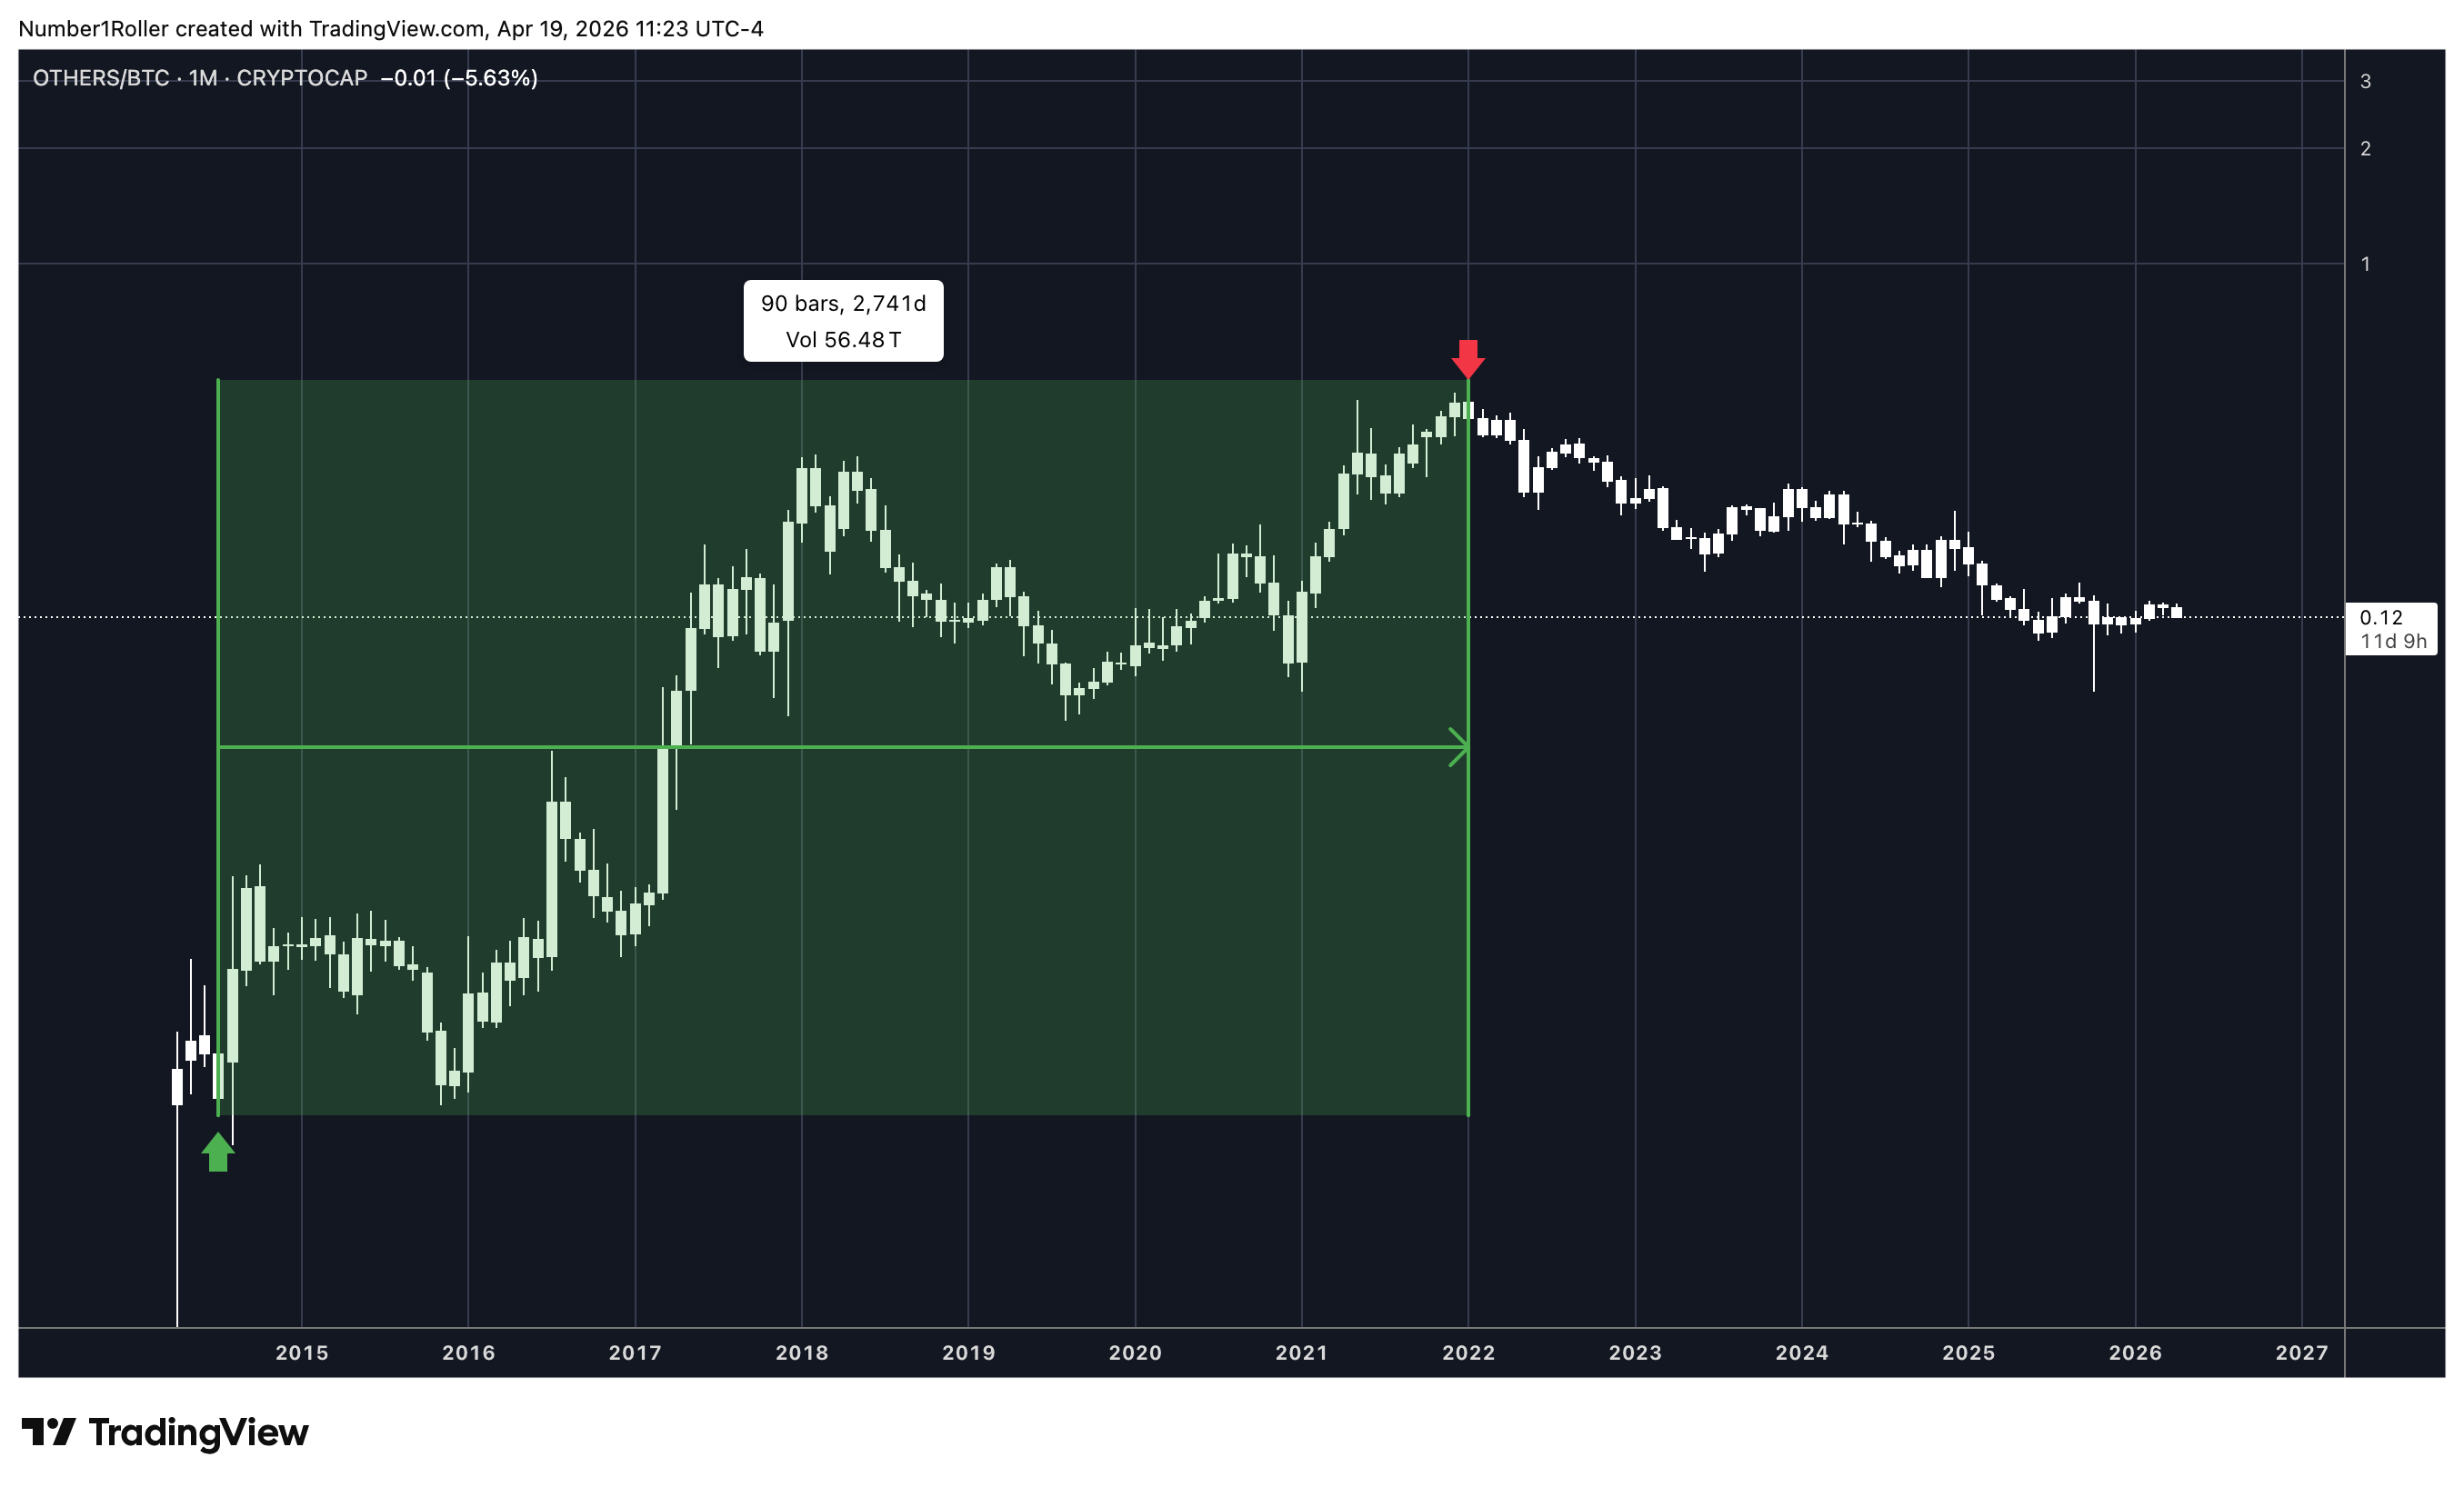
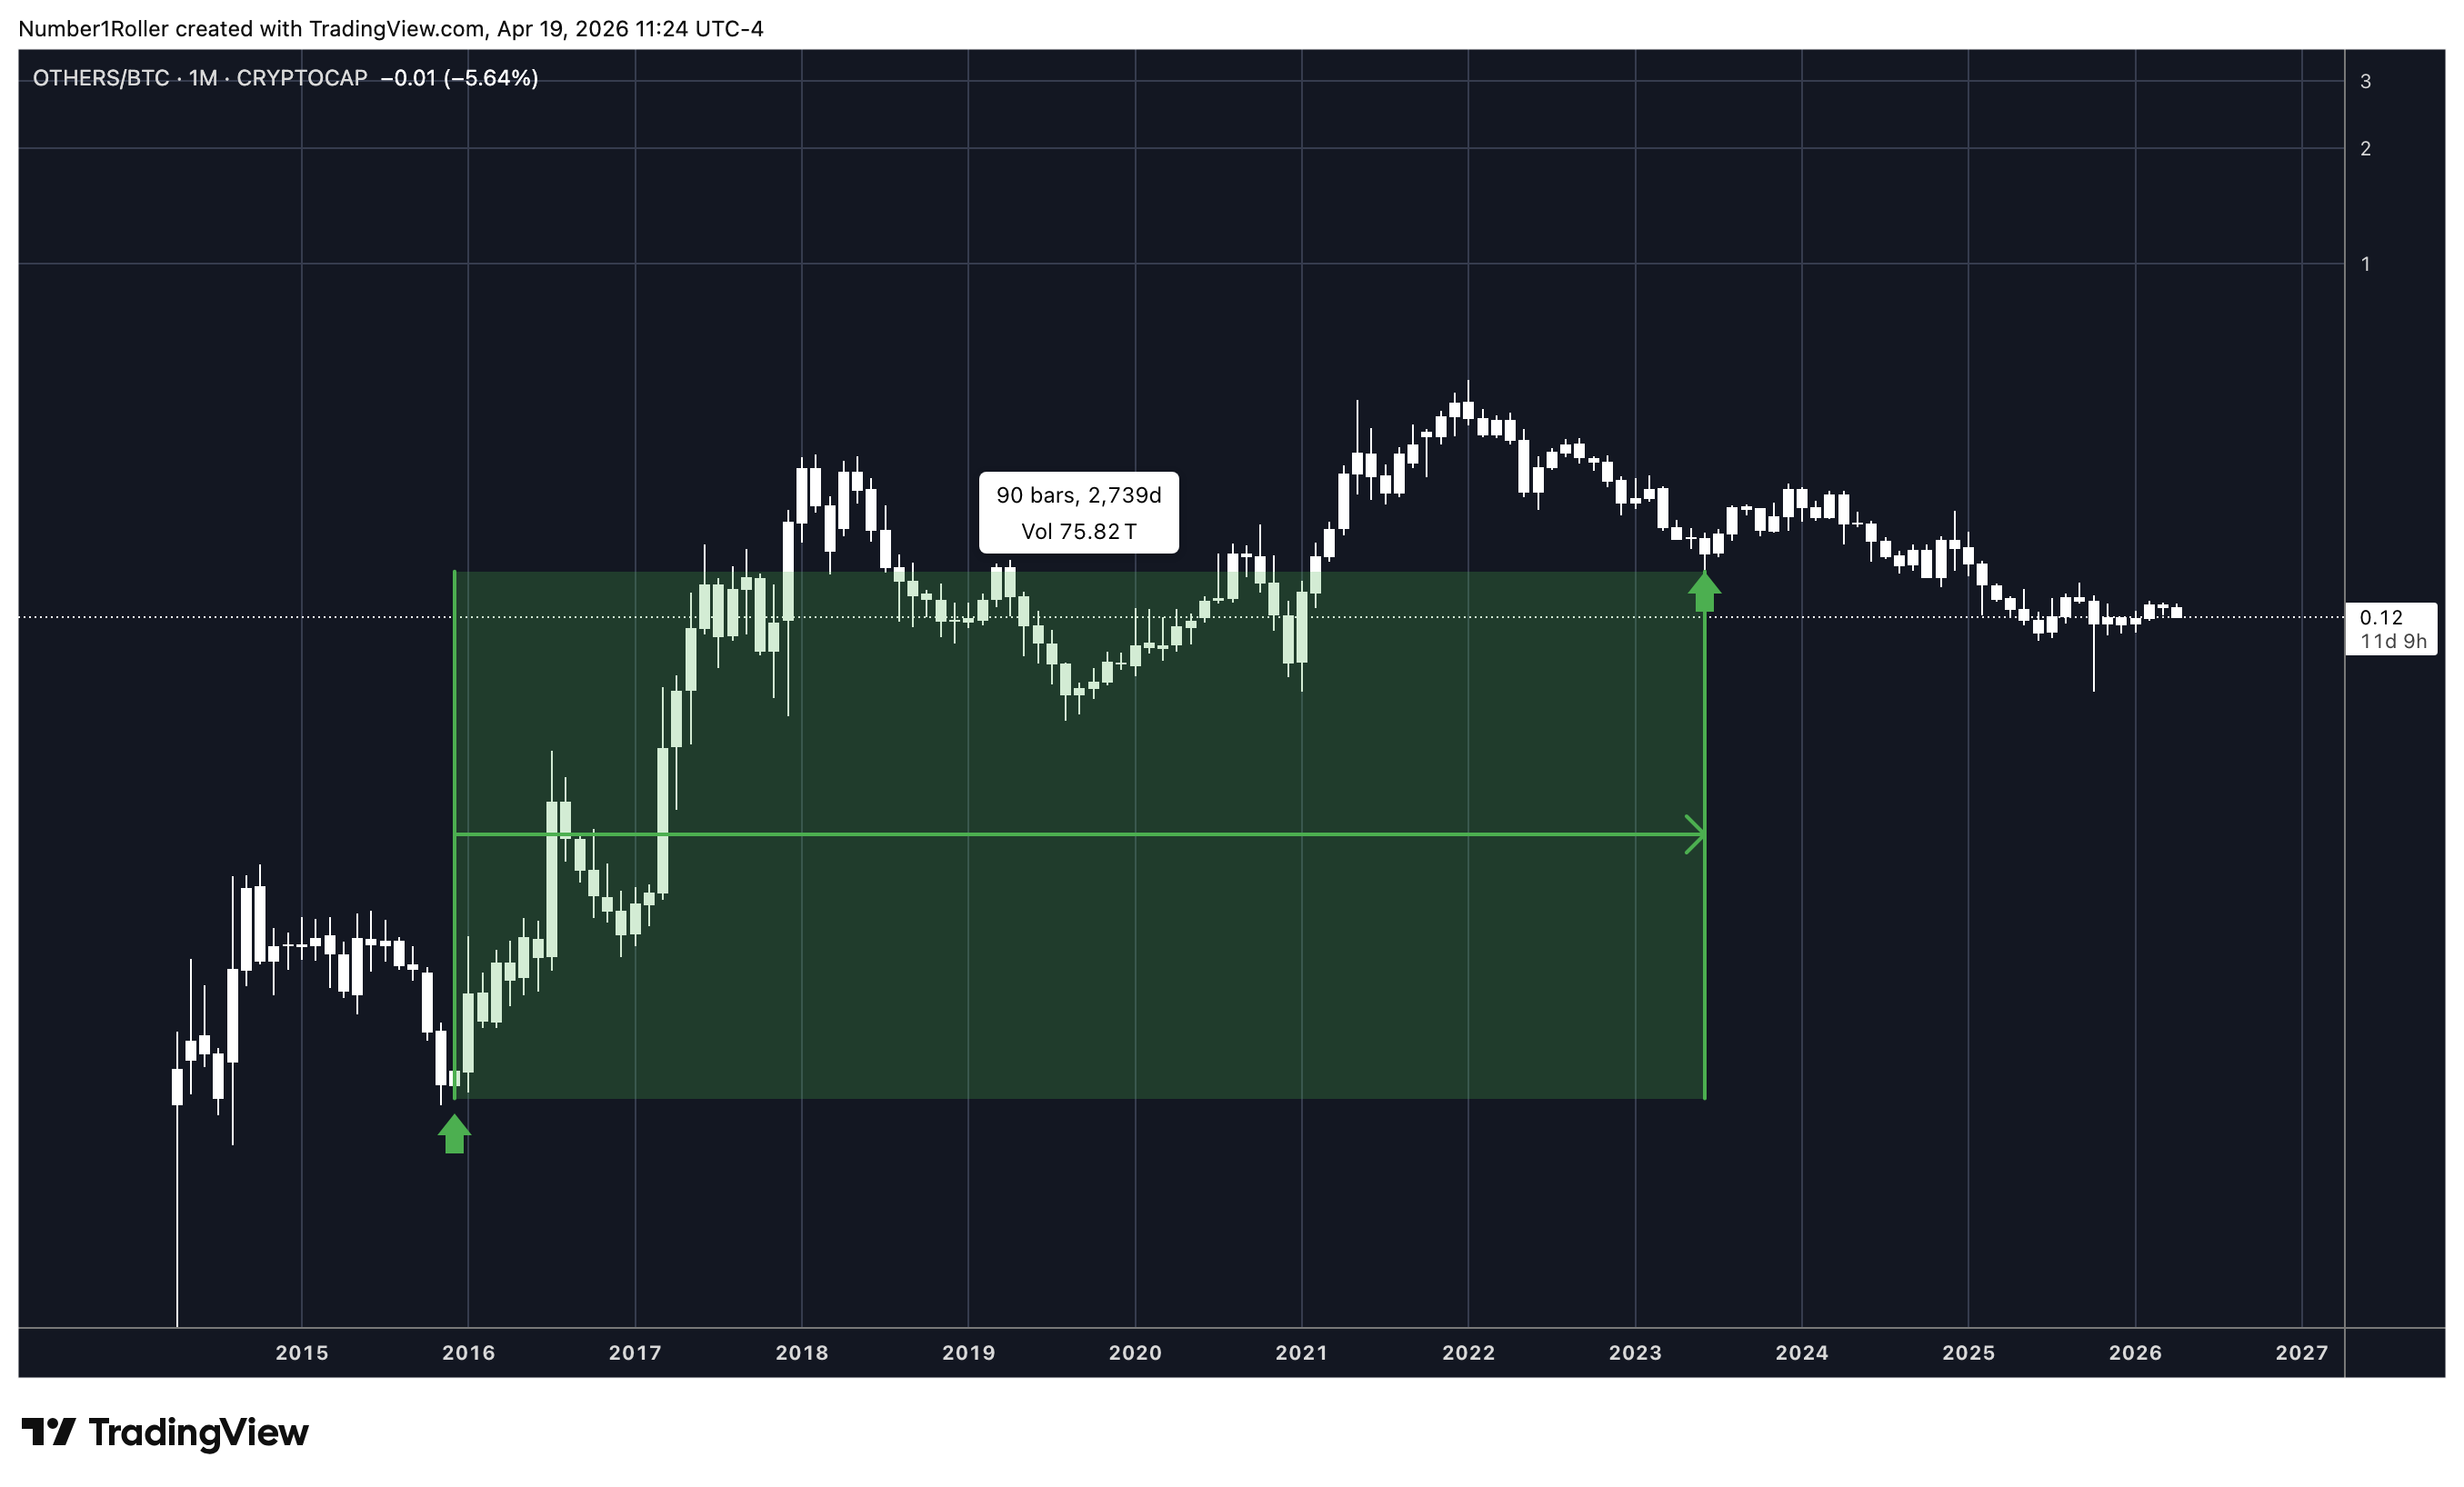
Here’s the key: when we have a major top-to-bottom 60-week down move like the one we just completed, the opposite move has been at least 90 weeks — often longer.
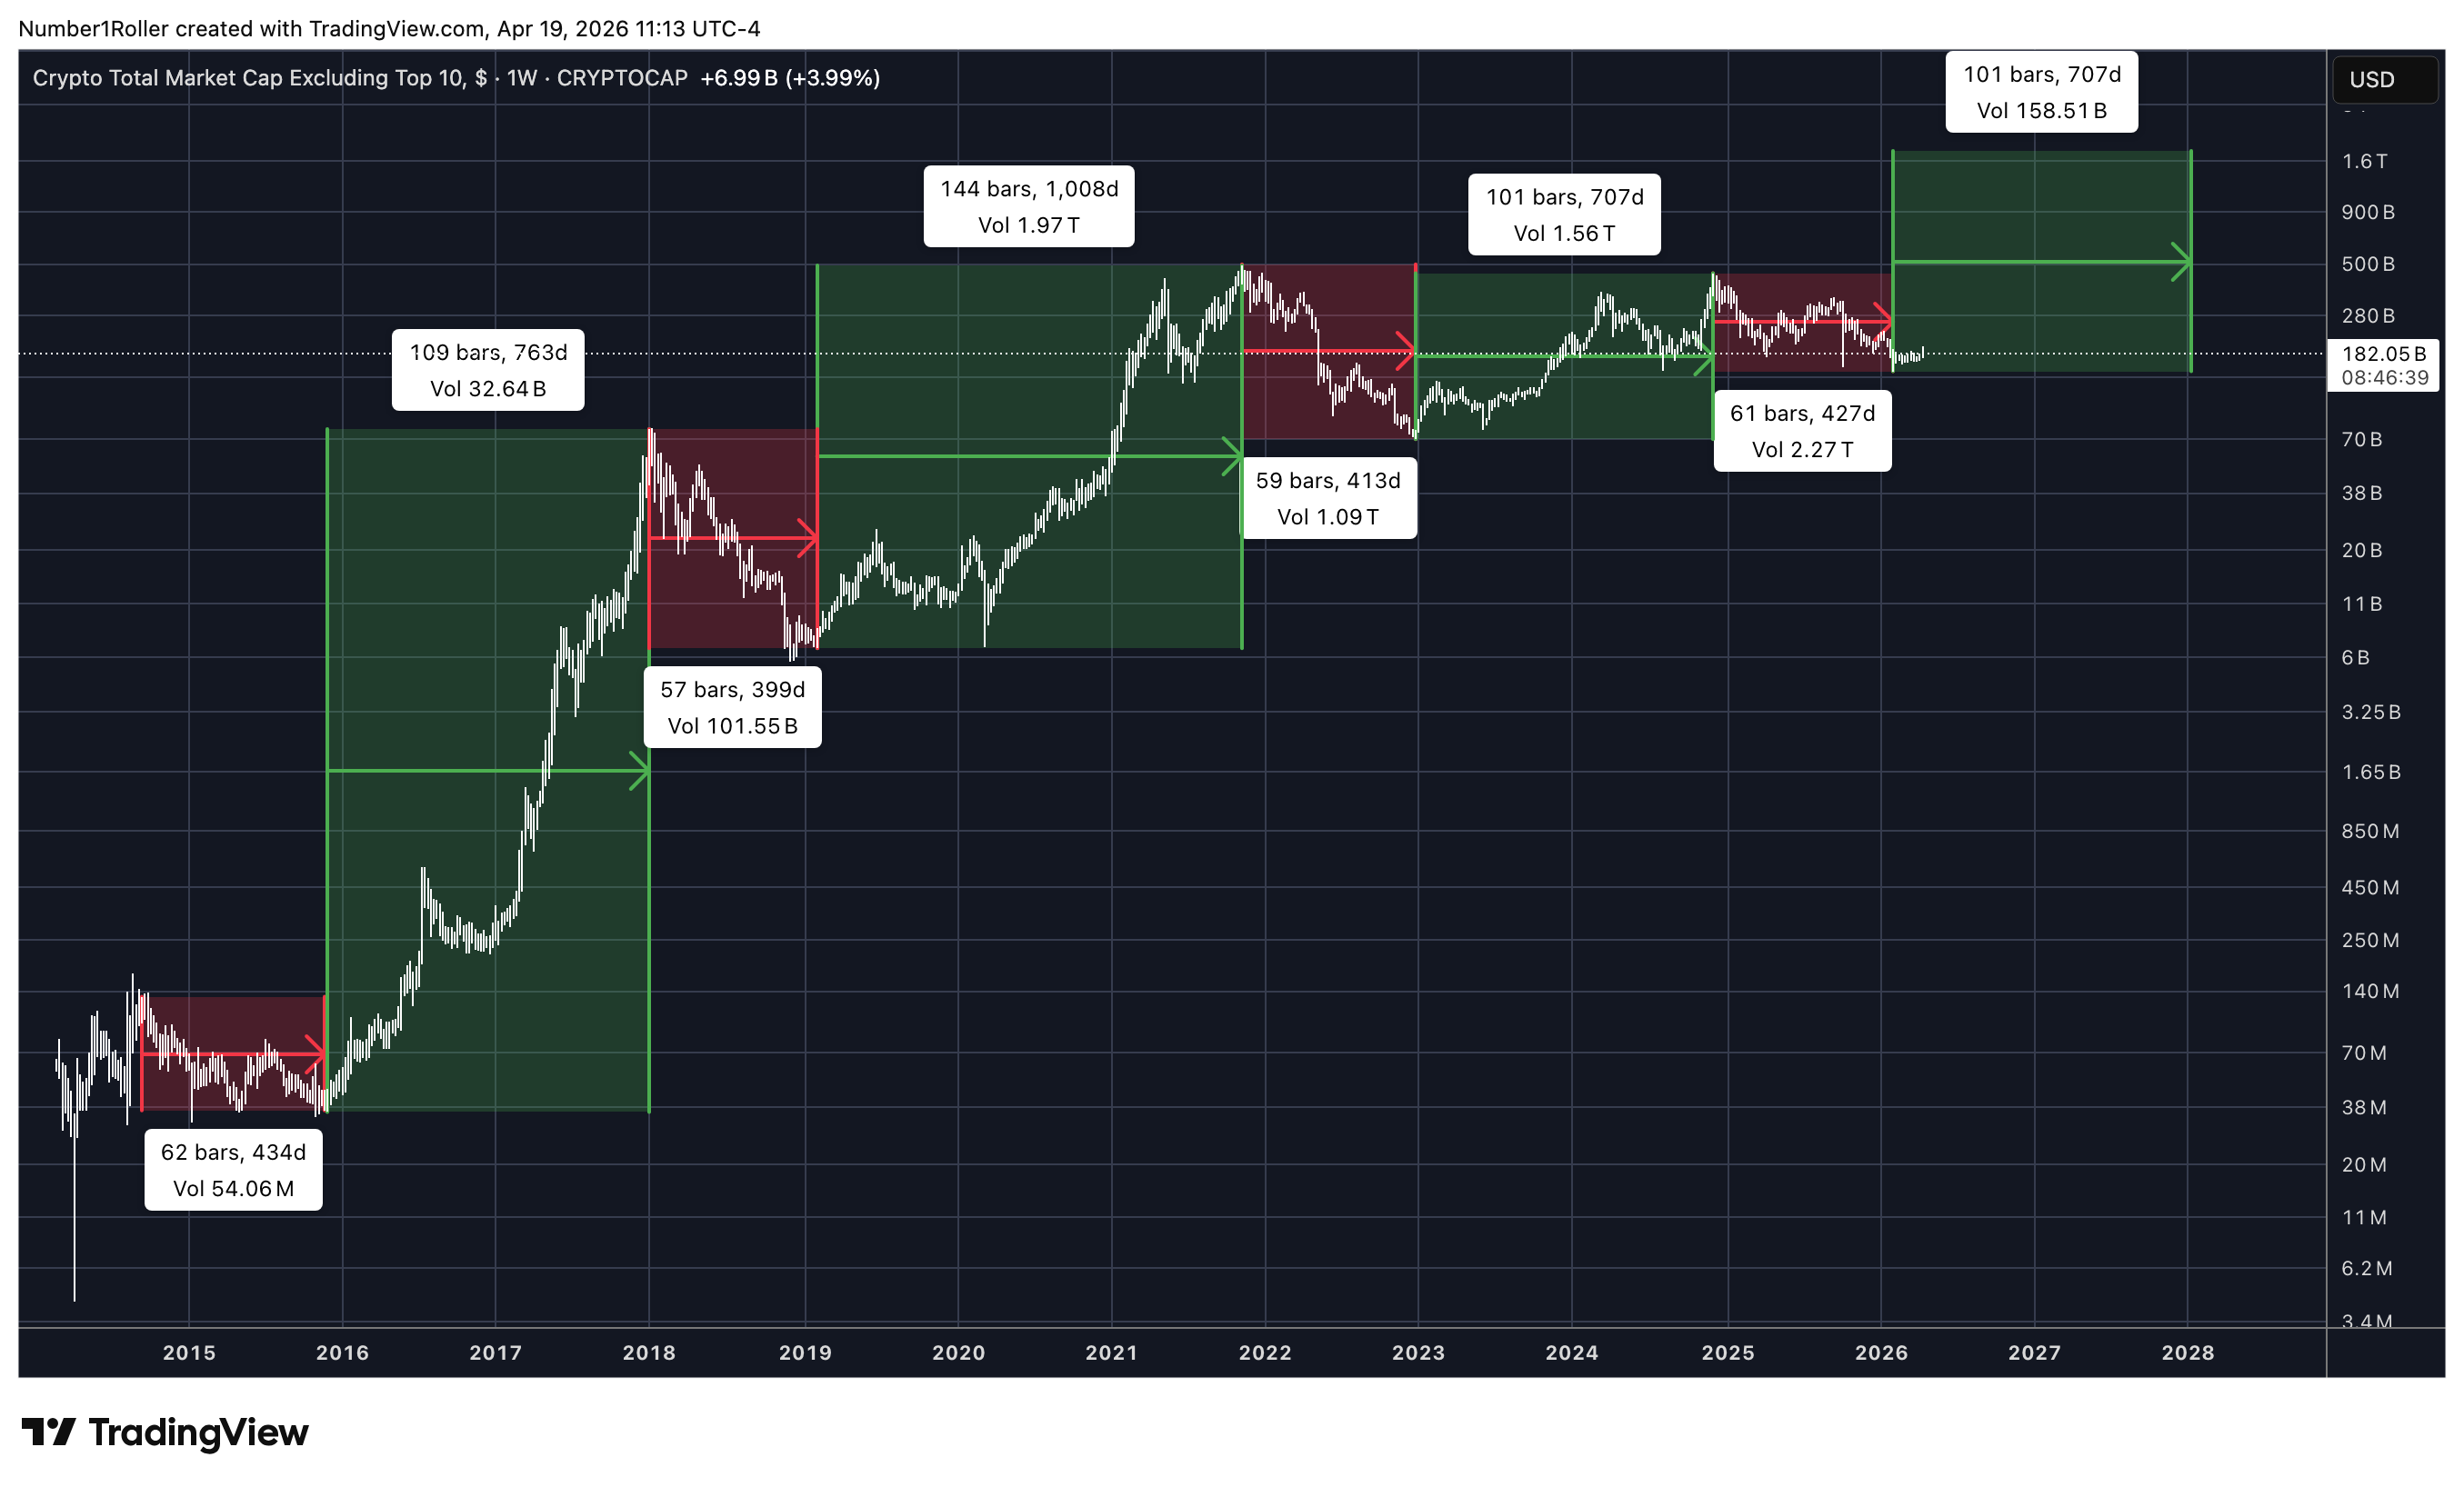
2016 bottom run: 109 weeks
2019 bottom run: 144 weeks
2023 bottom run: 101 weeks
Even being conservative, we’re looking at a 90-week run from here, which projects a top mid-to-late 2027. Obviously there will be pullbacks along the way, but the timing of this is irrefutable.
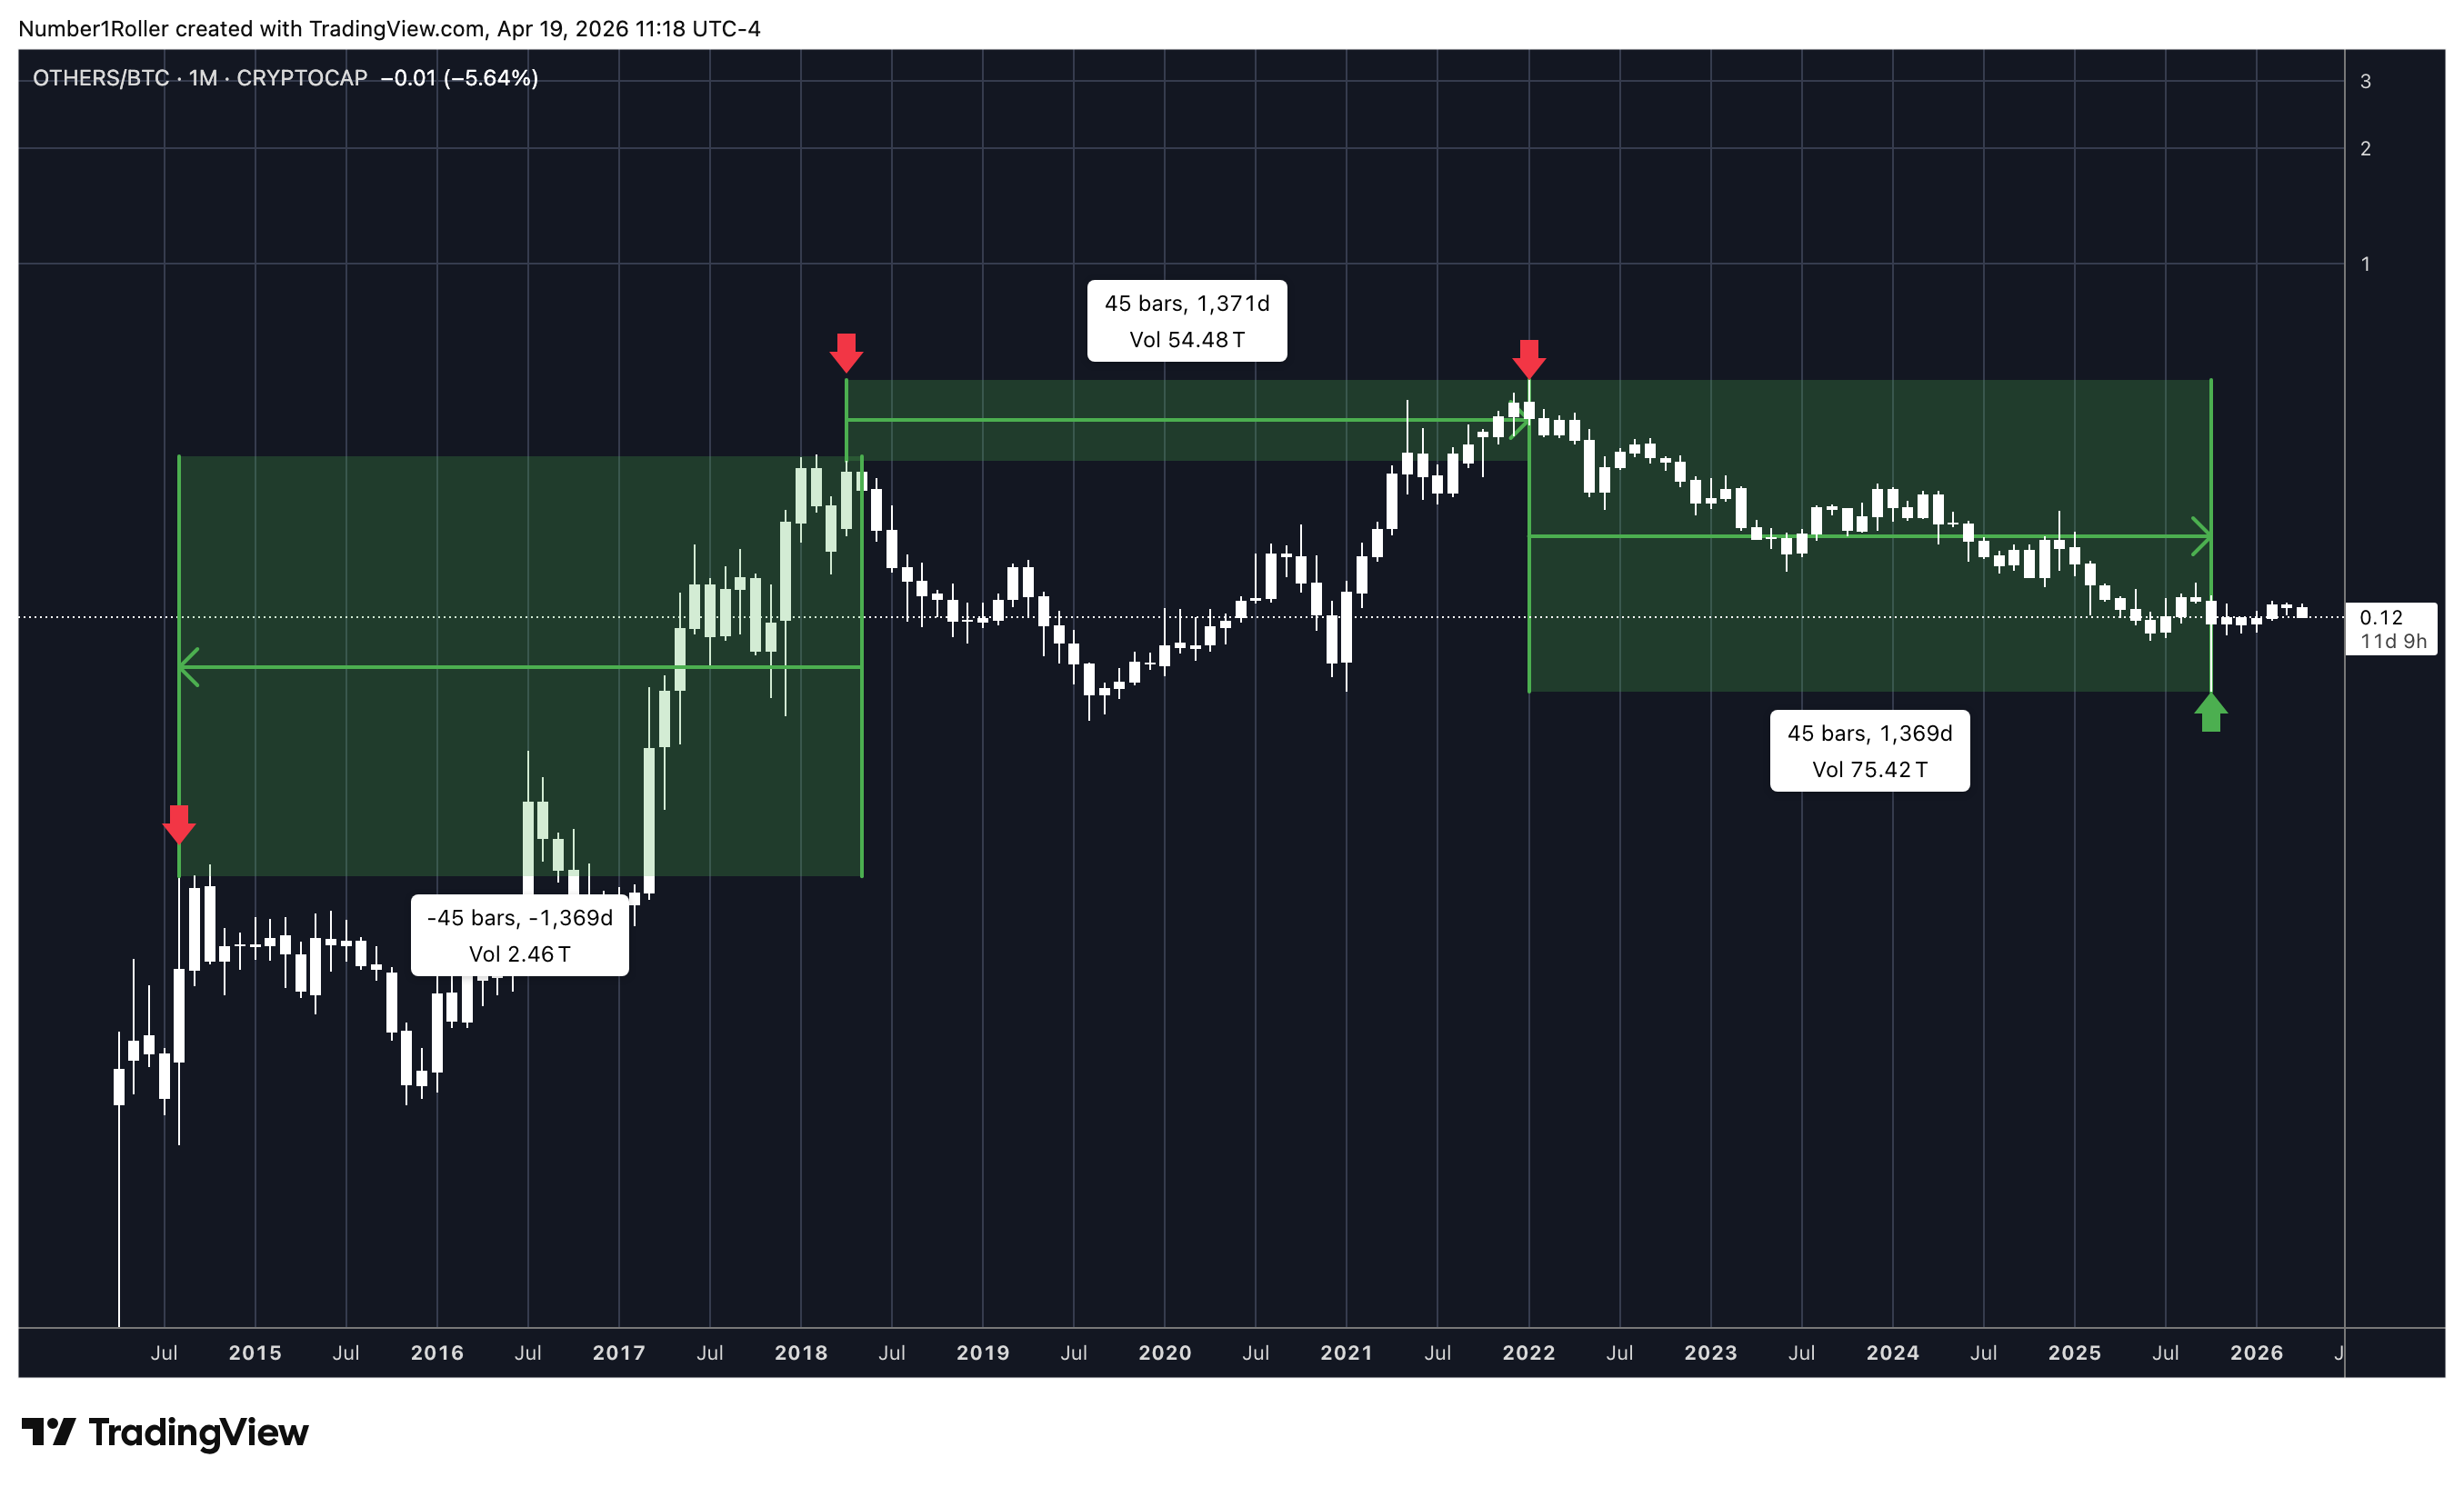
Zooming Out: The 45-Month + 60-Month + 90-Month Cycle Convergence
On the monthly timeframe, Others has proven to hold a very strong 45 month, 60 month, and 90 month cycle all throughout its history.
45 Months
This is something we have shown many times before but 45 months from a major turn has always marked a significant macro change in the market. We saw that exact 45 month time factor call the October flash crash low.
60 months
60 months is another very strong time cycle that has worked its power on this chart. 60 months is 5 years a cycle we are pounding the table on.
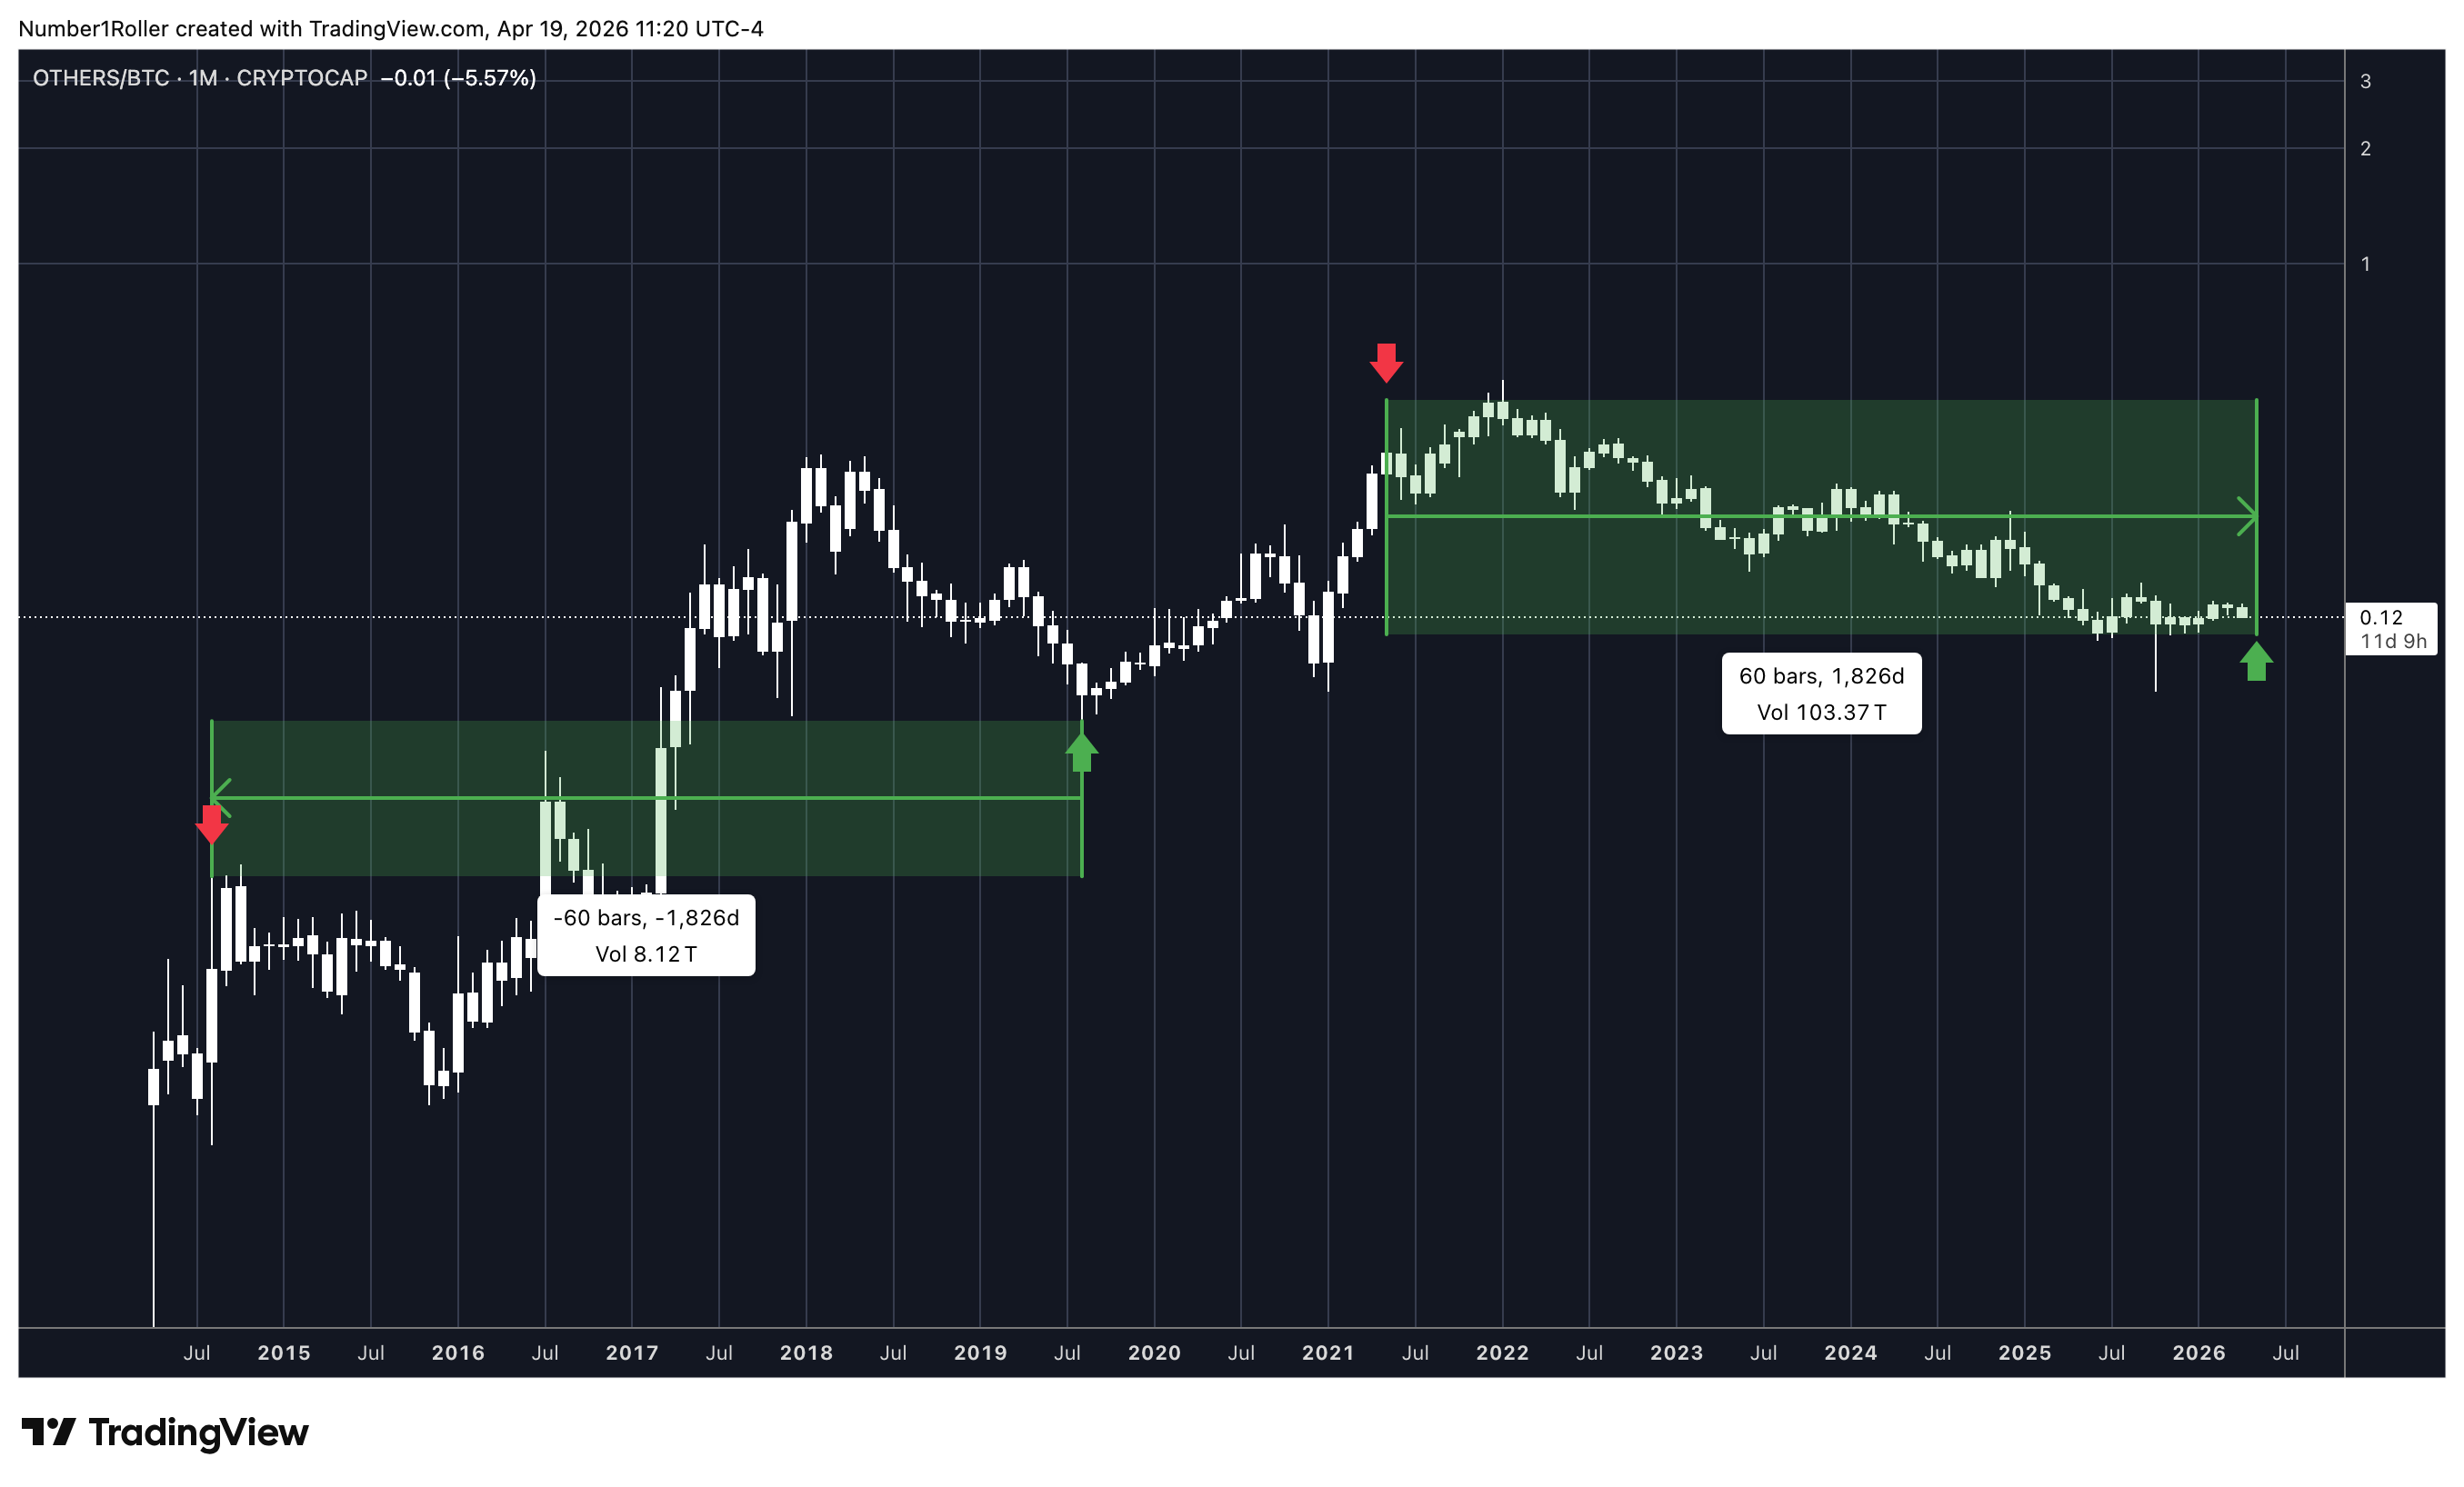
You have both a 60 month top to bottom cycle as well as a 60 month bottom to bottom cycle at work right now. That is all in confluence with the 45 month cycle.
90 month cycles
If 45 month cycle work then it only makes sense that the even bigger 90 month cycle would show up. And sure enough it shows up in all three phases below.
90 month bottom to top cycle
90 month bottom to bottom cycle. (this bottom gave us the 2023-24 run)
90 months from top to bottom exactly on the October 10 crash.
30 Month Bull Markets
If we have a major macro confluence happening right now between the 45, 60, and 90 month time factors then surely the 30 month cycle also shows up.
And sure enough the bull markets in this chart have lasted right on the 30 month mark.
But here’s the real setup. We have ALL 4 major high-timeframe cycles converging right now:
A 30-month cycle from the last major bottom
A 45-month cycle that has marked every major inflection point — 45 months to a major liquidation bottom, 45 months to a major top, 45 months to this current bottom
A 60-month (5-year) cycle — altcoins are in a 5-year cycle, Bitcoin is in a 5-year cycle, and every 5 years is where we really shift into altcoins
A 90-month cycle from the May 2018 top
When we get all cycles on a monthly time frame converging like this you can guarantee a major market shift is happening.
Historically the bull market moves that followed lasted 30 months. Using the 60-week cycle framework gets us to mid-to-late 2027 and using the monthly cycle framework suggest late 2027 early 2028 before the next major top.
We are in the very early innings after a 5 year drought in alts.
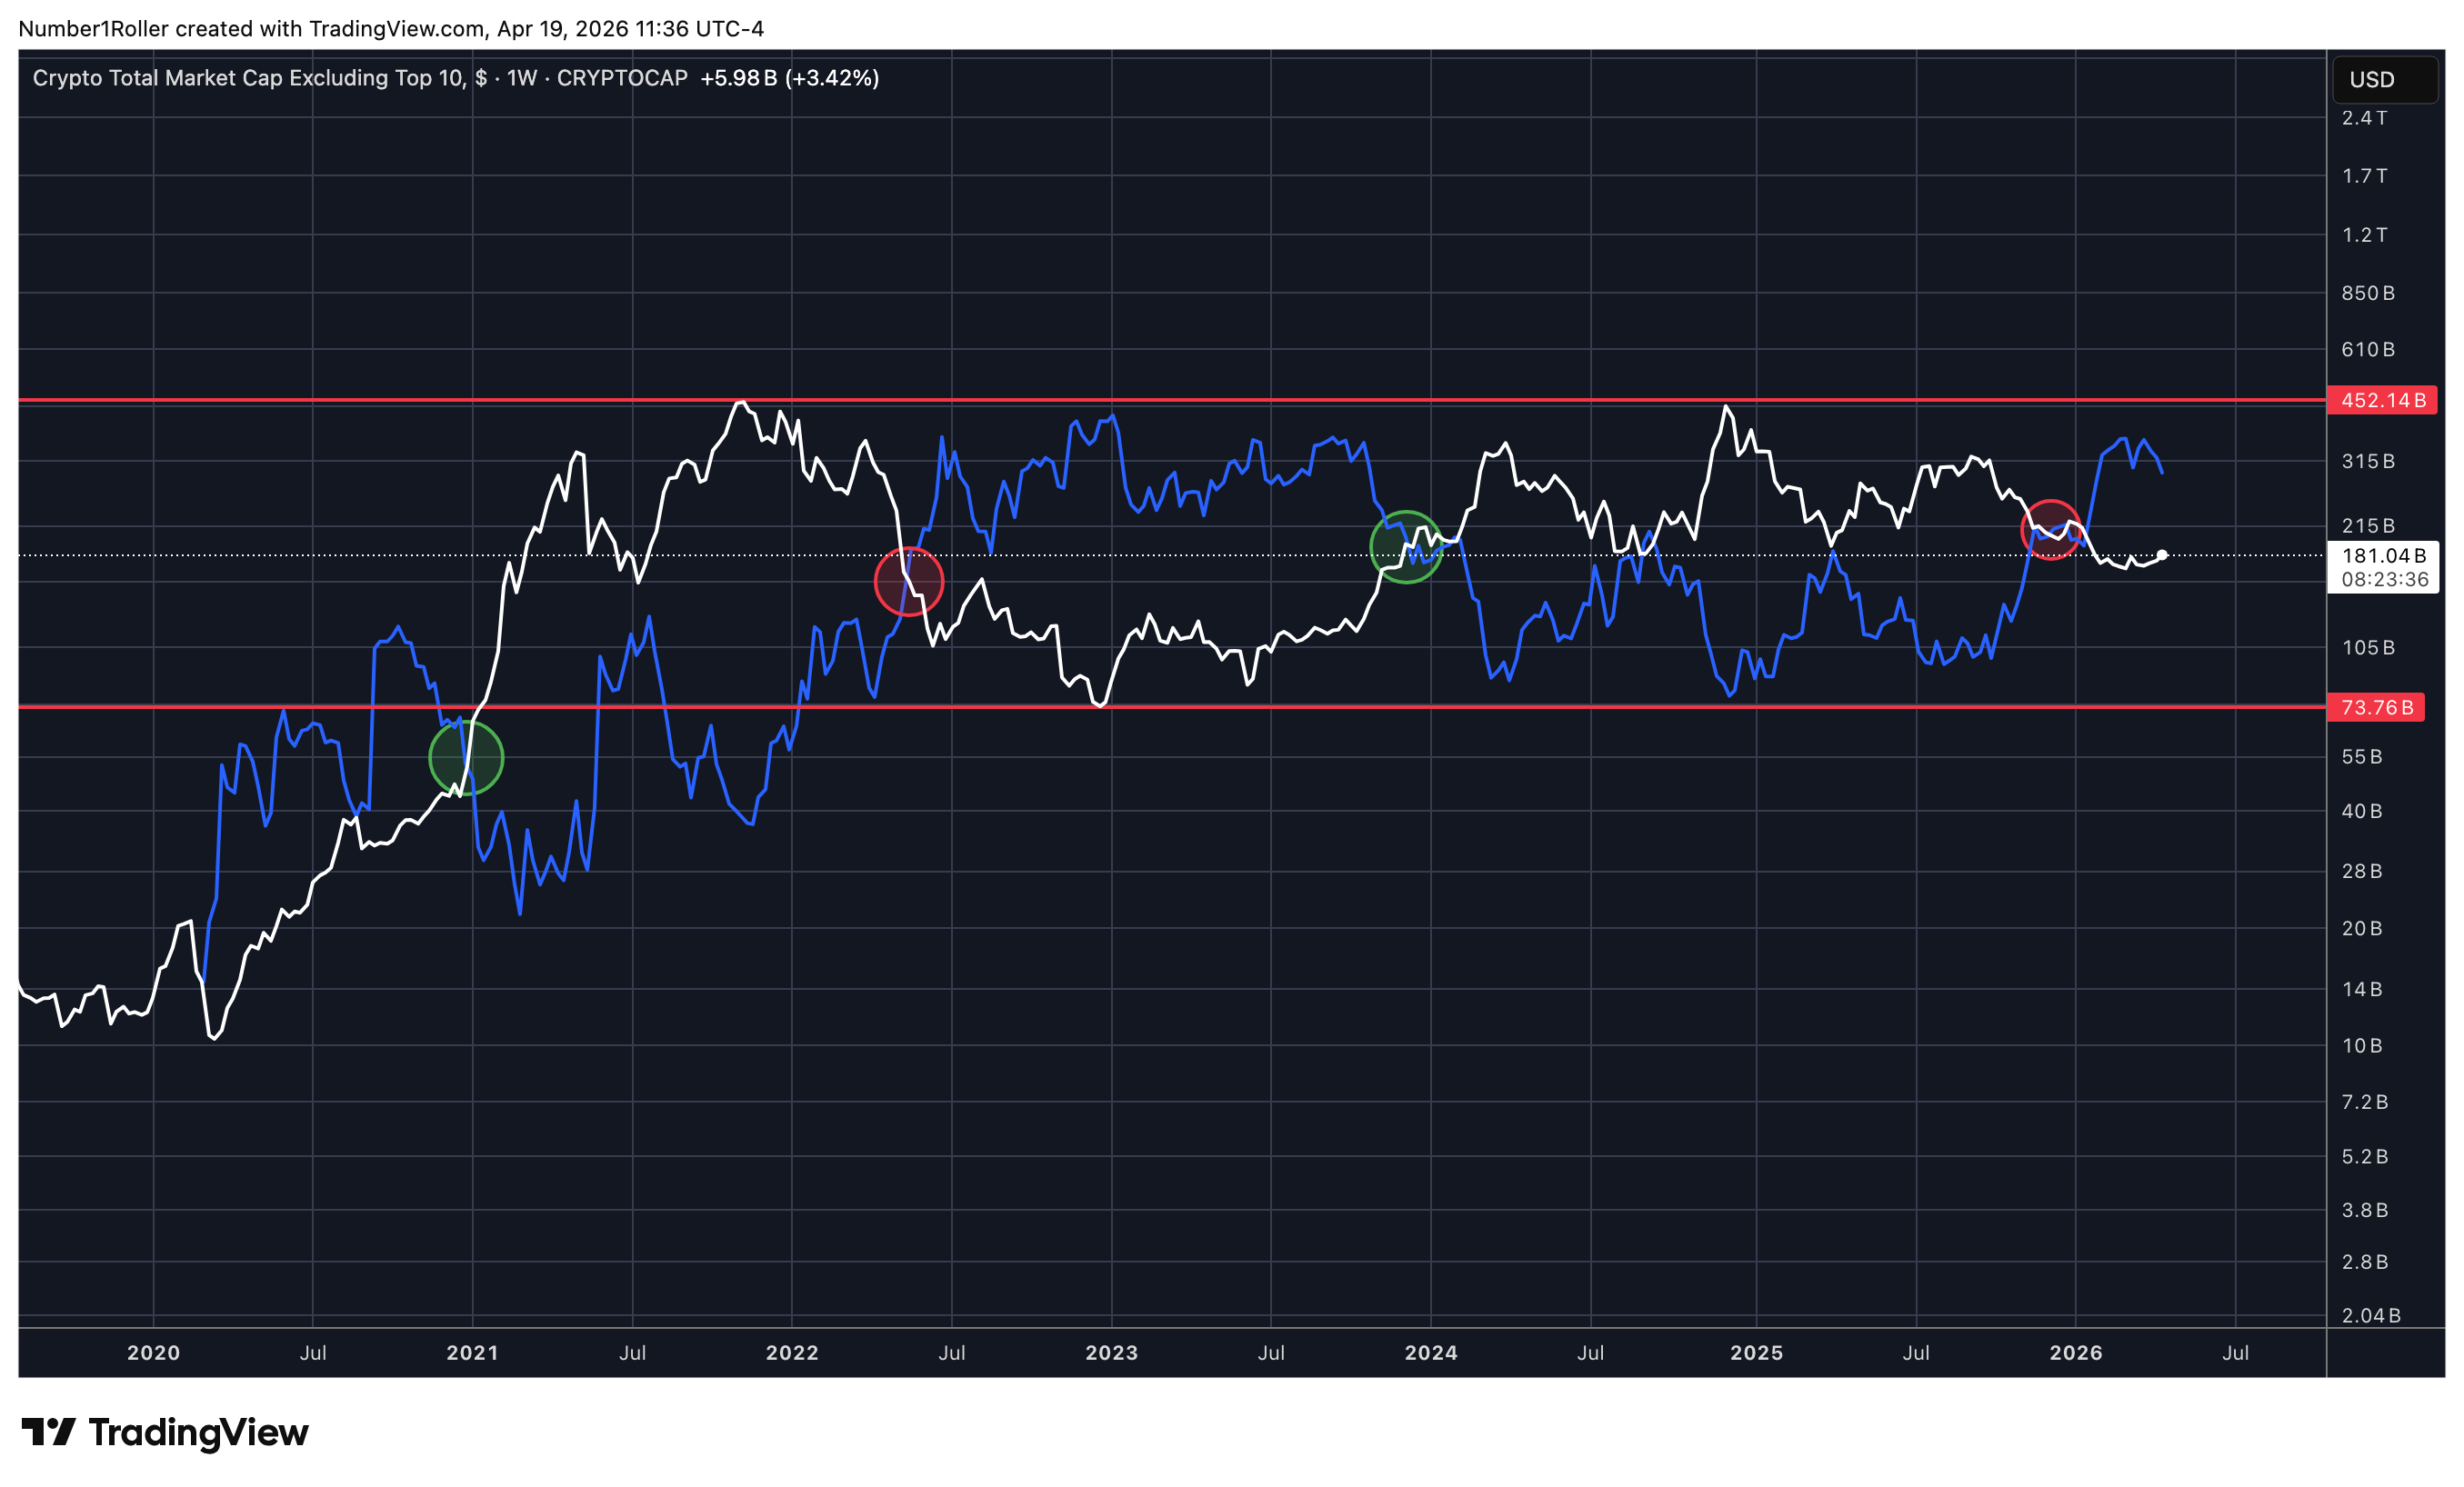
Stablecoin Dominance: Confirming the Bear Bottom
One more chart worth sharing to confirm this view is the USDT.D chart. This chart shows the market cap dominance of the largest stable coin issuer. When stables are up it signals a flight to safety, but when stables go down it signals a shift back into risk.
Right now we are breaking down out of the uptrend in this chart. You can see what the TOTAL3 market cap did each time this uptrend broke down. The result is a major move up. Stables just peaked near the 2022 bear market low levels.
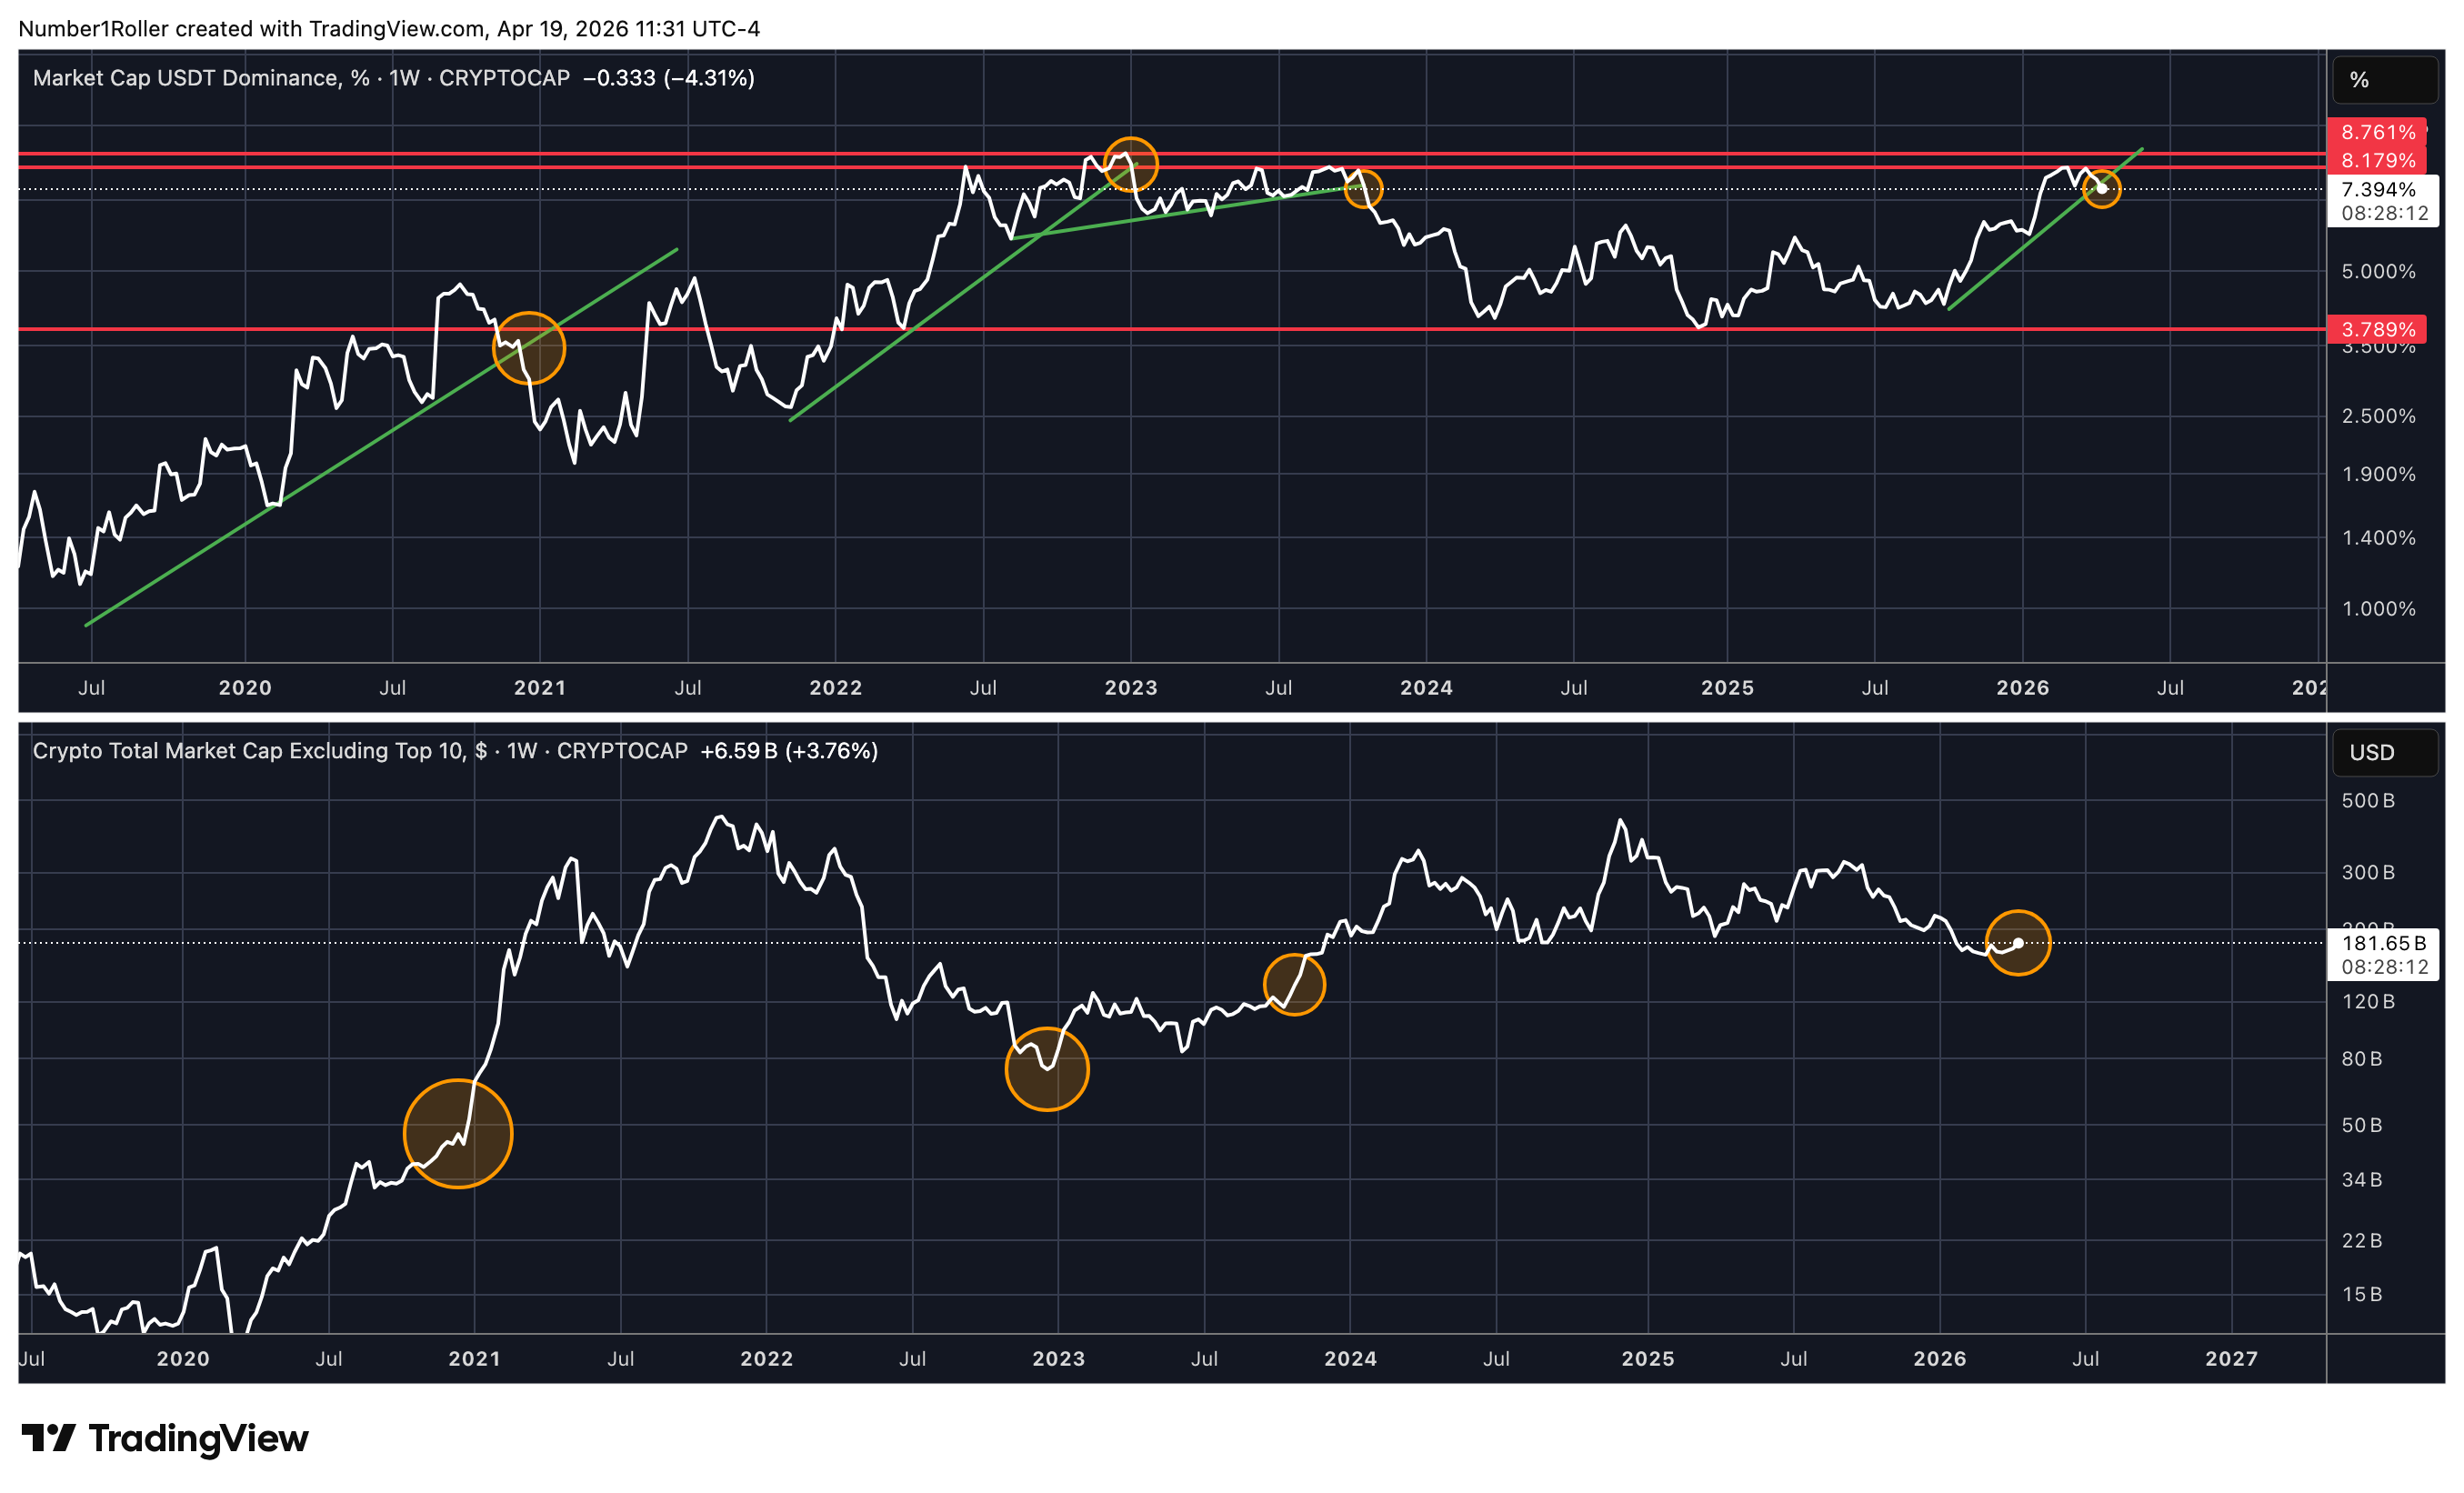
You can see this relationship is directly inverse to what alt coins do.
What this tells us: the market did top in December 2024, and we’ve had a 14-month on-chain bear market. Most of us have felt that. But the cycle is rolling over.
The Setup, In Plain English
Let me pull it all together:
Structure is in place. ETH has consolidated sideways for 60 months — the same range it traded in 5 years ago. That’s a huge flat consolidation and the same structural setup we saw before the last two parabolic moves.
Conditions are in place. IWM breaking out of a 5-year base. ISM rolling up. Gold topping. Copper-Gold ratio bottoming. ETH divergences resolving. Stablecoin dominance breaking down. Broader risk backdrop mirroring an overlap between late 2016 and late 2020 conditions.
Timing is finally satisfied. 60 months of ETH consolidation. A 60-week down cycle in Others complete. Four high-timeframe cycles (30, 45-month, 60, and 90-month) converging for only the third time ever. (previous two were the 2021 top and the 2023 bottom)
And sentiment couldn’t be better. Nobody believes alt season happens again. Most people are strictly staying in BTC. Everyone is still mentally anchored to a “four-year cycle” that’s been obsolete since 2021.
Price Targets and Timeline
ETH: $16,000 over the next 12–18 months (the 90-week cycle projection)
Altcoin cycle top: mid-to-late 2027
Path: not a straight shot — expect pullbacks — but the major trend is turning up for the first time in 3 years
The next 12–18 months are likely to deliver more than the last five years combined. This is a massive asymmetric opportunity and it’s setting up while nobody wants anything to do with crypto.
Final Thought
At a certain point, you have to make a decision.
Either you continue reacting to short-term noise like the majority of the market—or you start positioning around high timeframe structure, timing, and asymmetric setups like this one.
Everything I’ve laid out here is what I’m personally using to position for what I believe will be the next major phase of this cycle.
This is one of those moments where getting it right actually matters. And the last five years haven’t given us many of them. This is one.
Nice work — enjoyed reading your analysis.
Your research is thorough and impressive. There is probably money to be made in ETH, but damn is it SLOW and EXPENSIVE